
Excertos do catálogo
88 88 For latest updates please visit our website: www.ophiropt.com / www.spiricon.com >
Abrir o catálogo na página 1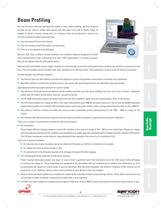
For over 28 years, Spiricon has been the leader in laser beam profiling. Spiricon systems provide all you need to profile both pulsed and CW lasers from W to Watts. Some 15 models of silicon cameras, along with our exclusive Pyrocam pyroelectric camera and various accessories allow measurements: From the deep UV to the far infrared From micrometer sized focal spots to large beams From very low powers up to kilowatts. Spiricon CCD beam profilers include hardware and software features designed to handle every measurement need. Conformance to ISO 11146 requirements is virtually assured > Ֆ...
Abrir o catálogo na página 2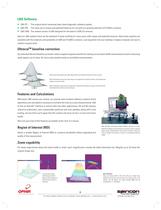
With LBA-FW, connecting multiple FireWire cameras is a snap. LBA-FW facilitates synchronizing the cameras in order to capture single events simultaneously from several locations. Allow the event to trigger the cameras, or setup a corresponding external trigger. Ultracal sets the baseline precisely. Beam width calculations become the most accurate.With the baseline set too low, laser wings are clipped off in the A/D converter. Calculated beam widths are now too small. With the baseline set too high, the algorithm interprets the baseline as wings in the laser beam. Calculated beam widths are...
Abrir o catálogo na página 3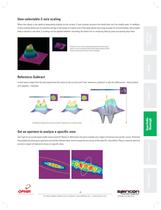
User-selectable Z-axis scaling > When the signal is too weak to adequately display on the screen, Z-axis scaling recovers the detail that cant be readily seen. In addition, Z-axis scaling allows you to examine energy in the wings of a beam even if the peak signal was large enough for normal display. Since beam data is stored in raw form, Z-scaling can be applied whether recording the beam live or analyzing data by post-processing days later. Viewed at 1x, the Z-axis provides little detail (left). At 8x the weak signal can now be examined easily (right). Without Ultracal, the DC baseline...
Abrir o catálogo na página 4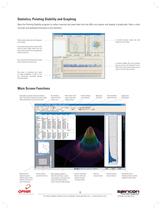
Peak location scatter plot with histogram color-coding. A pointing stability strip chart presents data over time for the Centroid X and Y, Peak X and Y and centroid radius from an origin or from the mean centroid.The radius is referenced from either an Origin established in LBA or from the continuously calculated Average Centroid position. A centroid location scatter plot with histogram color-codingAny notations entered here will be printed with the charts. Notes remain from one reset to the next and from one application startup to the next.Set a sample limit, and specify the results items...
Abrir o catálogo na página 5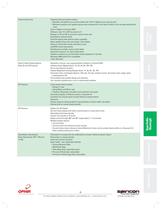
Current frame հ and 90 respectably in 1 а incrementsMultiple display options: Second Moment (D4s) Օ Օ Along X-Y axis Current frame and reference frame overlay 90/10 Knife Edge Օ Along Major and Minor axis Current frame minus reference frame (Reference frame can be another beam profile or a Gaussian fit.) Knife Edge (User selectable level) Օ Օ Positions: Manually controlled, track centroid, track peakSecondary display of reference beam or Gaussian fit Crosshairs for precise point-to-point distance measurements Apertures Overlay aperture shows graphical representation of beam width...
Abrir o catálogo na página 6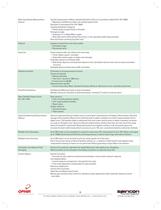
Other Quantitative Measurement ChoicesTop Hat measurement of Mean, Standard Deviation (Choice of calculation method) (Per ISO 13694) Օ Shows graph of signal levels of all pixels.Divergence angle Separate X, Y or Major/Minor angles Օ Maximum and Minimum within user defined spatial limitsGaussian Fit calculations (Per ISO 13694) Intensity distribution histogram Near field and far field method (Use of lens, or two separated width measurements)Row and Column summing (Log Data only)EllipticalAnalysis of major/minor axis beam widths Orientation angle Օ Roundness factorAperturesDrawn aperture with...
Abrir o catálogo na página 7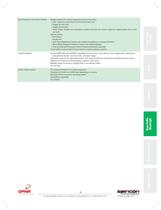
Synchronization and Capture ModesMultiple options for camera triggering and synchronization CW - captures continuously at the camera frame rate Օ Trigger-In from laser Trigger-Out to laser Օ Video Trigger. Display and calculations update only when the camera captures a signal greater than a user set levelCapture options Continuous Օ Single shot Live Video (Displays at camera rate without calculations or storage of frames) Օ Block Mode (Captures frames at camera rate without display) Post processing (Processes a block of frames previously captured)Frame buffer to store frames limited only by...
Abrir o catálogo na página 8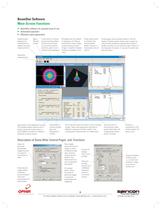
Profile graph shows profile chosen in the 2D display. Flexible system allows user to open as many profile screens as desired and choose X and/or Y profile or sum profile for each. Shown is the Gaussian fit screen. A top hat fit screen can also be shownStart/stop measurement Add button to add additional screens. This flexible system allows user to totally customize screen even to show different screens for different cameras on same screenAutomated or manual shutter, gain and background controlAll numerical values are shown in this compact screen. Note close agreement between 3 different...
Abrir o catálogo na página 9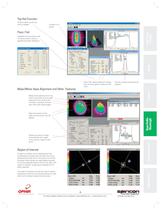
Choose which results you wish to displayAvailable for all functions with numerical results. Click on pass/fail and open dialog boxChoose X or Y profile Pass / Fail: values selected in dialog box will show green if pass and red if failTop Hat: Choose boundaries for analysisMeasure the distance from any point to any other point by right clicking on the mouse at the first point, moving to second point then right clicking again.Mark the position of the peak and centroid on the 2D display Display can be set to align automatically with major/ minor axes of image as well as XY. A region of...
Abrir o catálogo na página 10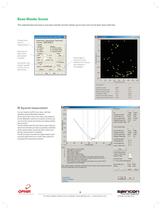
Choose timelimit for measurementSummary of data shown each period in log fileConcurrent with screen, log data to file in csv or text formatRecord data in microns or input distance from source and measure in microradians procedure has been thoroughly tested to give accurate results which are in most cases superior to automated M > Ҳ software does the rest. Step by step it tells you what to do and when you have successfully completed all the measurements required by ISO, it informs you that the measurement is completed. This M measurement systems. You can measure the M Ҳ of your laser with...
Abrir o catálogo na página 11Todos os catálogos e folhetos técnicos Ophir Optronics
-
 SP932U
1 Páginas
-
 ConoPoint-3
2 Páginas
-
 nova catalog
2 Páginas
-
 nova ii catalog
2 Páginas
-
 vega catalog
2 Páginas
-
 BeamWatchAM
2 Páginas
-
 StarBright
2 Páginas
-
 680274
1 Páginas
-
 P920 Beam Profiling Camera
1 Páginas
-
 L2000W-PF-120
1 Páginas
-
 L40(250)A-BB-50
1 Páginas
-
 IS1.5-VIS-FPD-800
1 Páginas
-
 Optimet Industrial Catalog 2017
34 Páginas
-
 Energy Sensors Accessories
1 Páginas
-
 High Energy Pyroelectric Sensors
1 Páginas
-
 StarLite
2 Páginas
-
 Power Meters & Interfaces
1 Páginas
-
 Power Meters Vega
2 Páginas
-
 Goniometric Radiometers
3 Páginas
-
 ccessories for Beam Profiling
4 Páginas
-
 1780 Instantly measure M 2
2 Páginas
-
 M200s
M200s3 Páginas
-
 NanoScan 2s
14 Páginas
-
 Quasar Wireless Bluetooth Interface
7 Páginas
-
 Pyrocam TM IIIHR & Pyrocam IV Series
7 Páginas
-
 LBS-100 Attenuato
1 Páginas
-
 LBS-400 Beam Splitters
1 Páginas
-
 maging UV lasers
1 Páginas
-
 Near Field Profilers
1 Páginas
-
 BeamWatch®
5 Páginas
-
 ModeCheck ®
3 Páginas
-
 Nova
Nova2 Páginas
-
 Calorimetric Power Meter
1 Páginas
-
 Power Pucks
1 Páginas
-
 High Power Thermal Sensors
1 Páginas
-
 Thermal Power Sensors
1 Páginas
-
 ompact Juno USB Interface
7 Páginas
-
 StarBrigh
2 Páginas
-
 Standard Photodiode Sensors
3 Páginas
-
 Medium Power BeamTrack-Power
1 Páginas
-
 Low Power BeamTrack-Power /
1 Páginas
-
 Introduction to Scanning-Slit Profilers
11 Páginas
-
 YAG Focal Spot Analyzer
2 Páginas
-
 Standard OEM Thermal Sensors
1 Páginas
-
 PC Interfaces Juno
5 Páginas
-
 Photodiode Energy Sensors
5 Páginas
-
 Pyroelectric Energy Sensors
1 Páginas
-
 Orion
Orion2 Páginas
-
 Laserstar
2 Páginas
-
 RP Sensors
2 Páginas
-
 Pyroelectric Energy Sensors
1 Páginas
-
 Special Photodiode Sensors
1 Páginas
-
 High Sensitivity Thermal Sensors
1 Páginas


Catálogos arquivados
-
 Laser Beam Profile Catalog
42 Páginas
-
 Laser Beam Prifile catalog
42 Páginas
-
 Complete Catalogue OPHIR
155 Páginas
-
 Laser Power Meter - Photodiode Heads
12 Páginas
-
 Laser Power Meter - Thermal Smart Heads
22 Páginas
-
 Laser Power Meters
4 Páginas

