


- Company
- Products
- Catalogs
- News & Trends
- Exhibitions
SubAngstrom Surface Texture

SubAngstrom Surface Texture
The document discusses the measurement of sub-angstrom surface texture using white light optical profilers, specifically the NewView™ 8000 series and above. These profilers utilize Coherence Scanning Interferometry (CSI) with Mx™ software to quantify surfaces with textures measured in fractions of a nanometer, essential for process control in optical manufacturing and precision machining.
Understanding System Noise
System noise is inherent in all measurement systems and is crucial to control when measuring very smooth surfaces. Noise can be minimized by controlling the measurement environment and averaging multiple measurements.
Environmental Controls
Key environmental factors include minimizing vibrations, maintaining tight temperature control, and managing airflow. These factors are critical for accurate measurements, especially with long working distance objectives.
Determining the System Noise
System noise is defined as the RMS or Sq of the difference between two subsequent measurements. It is recommended to calculate this value multiple times and use the mean as the surface topography repeatability (STR). The noise bandwidth of the system helps in assessing performance independent of acquisition time or averages.
Required Noise Floor
For rougher surfaces, a system noise 10x lower than the surface measurement is recommended. For smoother surfaces, a practical noise floor should be 2 to 4 times smaller than the desired measurement features.
System Error Characterization
After determining the acquisition mode and averages, perform a system error characterization by measuring multiple physical locations on an optical grade flat. This helps in generating a system error file to improve measurement accuracy.
Conclusion
Zygo demonstrates the capability of measuring surfaces smoother than 0.05 nm by controlling the measurement environment and selecting appropriate measurement parameters. For further information, contact Zygo or visit their website.
Catalog excerpts
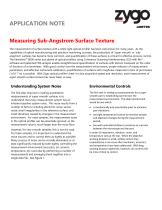
APPLICATION NOTE Measuring Sub-Angstrom Surface Texture The measurement of surface texture with a white light optical profiler has been well-known for many years. As the capabilities of optical manufacturing and precision machining increase, the production of ‘super smooth’ or ‘subangstrom’ surfaces has become more common, and quantification of these surfaces is critical for effective process control. The NewView™ 8000 series and above of optical profilers using Coherence Scanning Interferometry (CSI) with Mx™ software and patented FDA analysis enable straightforward quantification of surfaces with texture measured on the order of fractions of a nanometer. With good control over the measurement environment, proper selection of measurement parameters, and effective instrument calibration, quantification of surfaces with roughness measured in tens of picometers (1x10-12 m) is possible. With Zygo optical profiler’s best-in-class acquisition speed and resolution, areal measurement of super smooth surface texture has never been so easy. Understanding System Noise Environmental Controls The first step required in making quantitative measurements of super smooth surfaces is to understand that every measurement system has an inherent baseline system noise. This noise results from a number of factors including electronic noise, sensor noise, small irregularities in the reference surface, and small vibrations caused by changes in the measurement environment. For most samples, the measurement noise in the optical profiler can be essentially ignored, as the measurement value is much larger than the noise floor. The first task in setting up measurements for a super smooth part is establishing control over the measurement environment. The ideal environment would be one which: However, for very smooth samples, this is not the case. For these samples, it is important to understand the noise sources and to control them as tightly as possible. Many sources of noise can be virtually eliminated or at least significantly reduced by both tightly controlling the measurement environment (acoustics, air currents, temperature, etc.) and also by performing a number of measurements and averaging them together into a single data file. See Figure 1. is mechanically and acoustically quiet to minimize part vibrations; has tight temperature control to minimize sample and objective changes during the measurement period; has well‐controlled airflow to minimize air currents between the microscope and the part. In order of importance, vibration, noise, and temperature rank at the top. When the objective working distance is small, airflow control may essentially be a non‐issue after mechanics, acoustics, and temperature have b
Open the catalog to page 1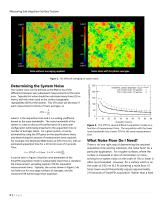
Measuring Sub‐Angstrom Surface Texture Same data with 16 phase averages. Data without averaging applied. Figure 1. The effect of averaging on system noise. Determining the System Noise The system noise can be defined as the RMS or Sq of the difference between two subsequent measurements of the same area. Typically this value should be calculated many times (10 or more), with the mean used as the surface topography repeatability (STR) of the system. This STR value will decrease if each measurement consists of many averages, as ݑưݑǰݑ wheretistheacquisitiontimeandAisascalingcoefficient knownasthenoisebandwidth.Thenoisebandwidthofthe...
Open the catalog to page 2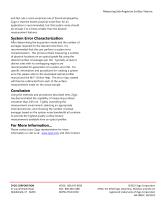
Measuring Sub‐Angstrom Surface Texture and fast rule a more empirical rule of thumb employed by Zygo is that the lowest practical noise floor for an application is recommended, but that system noise should be at least 2 to 4 times smaller than the desired measurement features System Error Characterization After determining the acquisition mode and the number of averages required for the desired noise floor, it is recommended that the user perform a system error characterization. This process entails measuring a number of physical locations on an optical grade flat using the desired number of...
Open the catalog to page 3All Zygo catalogs and technical brochures
 Zygo Nano Position Sensors
20 Pages
 Zygo Precision Optics & Systems
20 Pages
 Zygo Laser Interferometers
28 Pages
 Zygo 3D Optical Profilers
24 Pages
 Zygo Service Brochure
12 Pages
 Compass2 1-sheet - Optimized
2 Pages
 Compass 2™ Specifications
2 Pages
 Mx Surface Texture Parameters
28 Pages
 PMI vs Fringe Analysis
2 Pages
 Mx Films Analysis Software
2 Pages
 Interferometer Scale Facton
2 Pages
 Coherent Artifact Reduction
3 Pages


- Automation software solution
- Windows software
- Optical microscope
- Industrial software
- Interface software
- Quality software
- Inspection microscope
- Glass lens element
- Spectrum lens element
- Optical window
- Surface measuring machine
- Optical lens element
- Compact microscope
- Visible lens element
- Digital microscope
- Metrology software
- Industrial surface measuring machine
- Instrument software
- Fluorescence microscope