Power Spectral Density Analysis
1 /2Pages

Power Spectral Density Analysis
1 /2Pages
Catalog excerpts
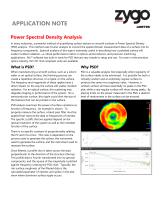
APPLICATION NOTE Power Spectral Density Analysis In many industries, a powerful method of quantifying surface texture on smooth surfaces is Power Spectral Density (PSD) analysis. This method uses Fourier analysis to convert the spatial domain measurement data of a surface into its frequency components. Spectral analysis of this type is extremely useful in describing how a polished surface will scatter incident radiation—a critical performance metric in optical, semiconductor, and precision machining applications. Mx™ software has built-in tools for PSD that are very simple to setup and use. For users in the precision optics industry, ISO 10110-8 compliant units are available. When manufacturing a smooth surface, such as a silicon wafer or an optical surface, the finishing process can create a repetitive structure, or a ripple, on the surface. The frequency and magnitude of these ripples have a direct impact on the way the surface will scatter incident radiation. For an optical surface, this scattering may degrade imaging or performance of the system. On a semiconductor surface, this ripple could limit the size of the features that can be printed on the surface. PSD is a valuable analysis tool especially when regularity of the surface needs to be minimized. It is possible for both a virtually random and an extremely regular surface to produce the same rms roughness value. However, a random surface will have essentially no peaks in the PSD plot, while a very regular surface will show strong peaks. By placing limits on the power measured in the PSD, a desired level of randomness in the surface can be ensured. PSD analysis examines the power of surface variations as function of frequency. An example is shown. To properly measure the surface, a band pass filter must be applied that restricts the data to frequencies of interest. The specific cutoffs that are applied depend on the optical resolution of the system as well as the intended function of the surface. There is no specific constant of proportionality relating the PV and rms errors. This ratio is dependent on the process used to generate the surface, the instrument used to generate the surface, and the instrument used to measure the surface. Once filtered, a profile slice is taken across the data perpendicular to the direction of the structure (the lay). This profile data is Fourier transformed into its spectral components, and the square of the magnitude is plotted against frequency creating the PSD chart. Typically, the rms surface roughness of the filtered data is the calculated parameter of interest; and spikes in the plot show where dominant surface ripple occurs.
Open the catalog to page 1
Mx™ PSD Analysis Second, PSD analysis requires band pass filtering. For compliance with ISO10110-8, the filter should be an FFT with a Gaussian cutoff—the standard form of an FFT in Mx software. For more information… Visit us at www.zygo.com and click the Contact Us button. While only a single trace is required, using one slice is susceptible to small local variation in the measurement surface. In order to avoid these problems, Mx software enables the averaging of parallel slices in the spatial domain by setting the width of the slice. The above figure shows a typical PSD plot and the twodimensional...
Open the catalog to page 2All Zygo catalogs and technical brochures
 Zygo Nano Position Sensors
20 Pages
 Zygo Precision Optics & Systems
20 Pages
 Zygo Laser Interferometers
28 Pages
 Zygo 3D Optical Profilers
24 Pages
 Zygo Service Brochure
12 Pages
 Compass2 1-sheet - Optimized
2 Pages
 Compass 2™ Specifications
2 Pages
 Mx Surface Texture Parameters
28 Pages
 SubAngstrom Surface Texture
3 Pages
 PMI vs Fringe Analysis
2 Pages
 Mx Films Analysis Software
2 Pages
 Interferometer Scale Facton
2 Pages
 Coherent Artifact Reduction
3 Pages


- Automation software solution
- Windows software
- Microscope
- Industrial software
- Optical microscope
- Interface software
- Quality software
- Inspection microscope
- Glass lens element
- Spectrum lens element
- Optical window
- Surface measuring machine
- Optical lens element
- Compact microscope
- Visible lens element
- Metrology software
- Industrial surface measuring machine
- Instrument software
- Round mirror
- Digital microscope