 Website:
VMI International AB
Catalog excerpts

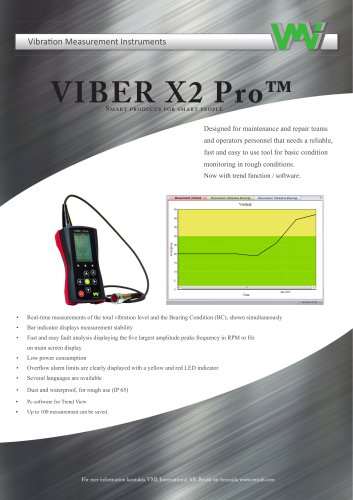
Press the “yes”-button in the dialog box and continue with marking “Department” or another of the top level alternatives. The top level of the database is usually a building or department, which must be added to a measurement project (the database). VIBER X2 Pro™ VIBER X2 Pro™ Vibration Measurement Instruments An instrument for analysing and trending An instrument for analysing and trending VibraƟon Measurement Instruments When all measurements are saved forcan choose people and see the changes from the start of the Press the “yes”-button in the dialog box and continue with marking “DepartSmart products you smart the graphics measurements. ment” or another of the top level alternatives. The top level of the database is usually a building or department, which must be added to a measurement Choose the direction and time for the trend diagramDesigned for maintenance and repair teams you want to study. project (the database). VIBER X2 Pro™ VIBER X2 Pro™ An instrument for analysing and trending Designedoperators personnel that needs a showing and for maintenance and repair teams An instrument To view the measured data just double click on the measurement in the project tree. The windowreliable,the for analysing and trending measures are automatically adjusted to the values that are shown. For changing the visualarange just use the and operatorseasy to use that needs reliable, fast and personnel tool for basic condition toolboxes in the header. fast and easy to useroughfor basic condition monitoring in tool conditions. monitoring in roughfunction / software. Now with trend conditions. Thereafter, write the name of the de- Thereafter, write the name of the department (and eventually description partment (and eventually description • Real-time measurements of the total vibration level and the Bearing Condition (BC), shown simultaneously for internal use) and continue with for internal use) and continue with Property, can be used for changing the unit displayed in the Diagram, all measuring points are available in all “next”. Real-time measurements of the total vibration level and the Bearing Condition (BC), shown simultaneously • Bar indicator displays measurement stability units like Velocity, Acceleration, Displacement. “next”. Bar indicator displays measurement stability • Fast and easy fault analysis displaying the five largest amplitude peaks frequency in RPM or Hz Fast and easy fault analysis displaying the five largest amplitude peaks frequency in RPM or Hz on main screen display on main screen display • Low power consumption Low power consumption • Overflow alarm limits are clearly displayed with a yellow and red LED indicator Overflow alarm limits are clearly displayed with a yellow and red LED indicator • Several languages are available Several languages are available 32 • Dust and waterproof, for rough use (IP 65) Dust and waterproof, for rough use (IP 65) Pc-software for Trend View
Open the catalog to page 1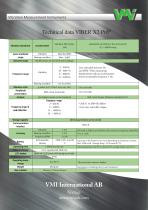
Vibration Measurement Instruments Technical data VIBER X2 Pr<5M Vibration transducer
Open the catalog to page 2All VMI International AB catalogs and technical brochures
-
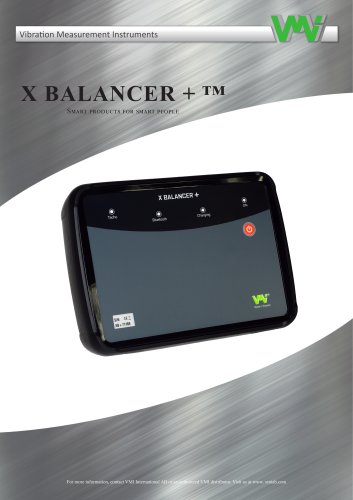
X Balancer+
8 Pages
-
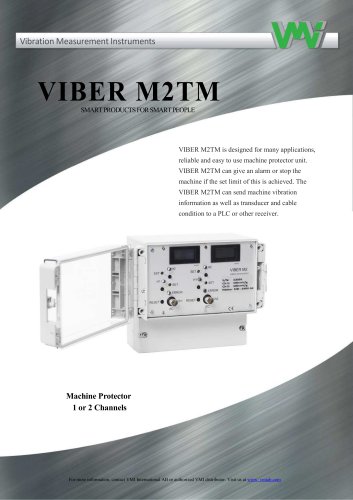
VIBER M2TM
4 Pages
-
VIBER X5™ MKIII
8 Pages
-
VIBER X3™
5 Pages
-
VIBER X2™
2 Pages
-
VIBER X1™
2 Pages
-
X-Viber™
2 Pages
-
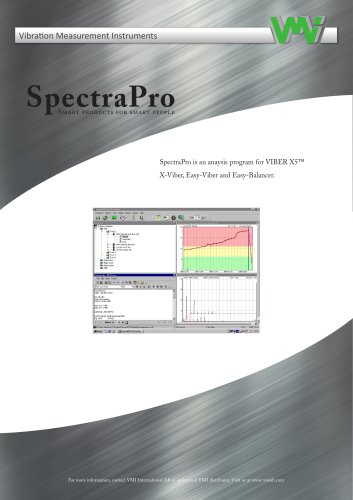
Spectra Pro
12 Pages

