

- Company
- Products
- Catalogs
- News & Trends
- Exhibitions
VibsensPro Condition Monitoring Software

VibsensPro Condition Monitoring Software
- Compatible with Vibsens measurement systems and supports devices such as VA-2000, V6000, V400, and VD-5.
- Enables automatic signal measurement, recording, and continuous alarm monitoring.
- Facilitates online and offline data review with a user-friendly interface.
- Supports report generation in Microsoft Excel and is compatible with various Windows versions.
- Offers Server and Display Client Mode.
- Used for vibration measurement and machinery fault analysis.
- Applicable in shaft balancing and structural modal analysis.
- Capable of digitizing and recording long-duration waveforms.
Vibsens-Pro® is a customizable software for vibration measurement and analysis, compatible with various Vibsens products. It provides efficient signal processing, flexible sampling rates, and user-friendly interfaces for sensor configuration and data analysis. The software supports both Metric and Inch systems and allows data access in both online and offline modes.
Hardware CompatibilityDesigned for VibSens hardware modules, the software features vary across devices like VD-5, V400, VA-2000, and V6000, focusing on input types, sampling frequency, and data transfer systems.
Software ModulesIncludes modules for time signal analysis, trend plotting, FFT spectrum analysis, and more. Each hardware device can utilize specific features such as balancing, diagnosis modules, and order analysis.
Introduction to Software Features- Time Signal: Displays dynamic data changes over short time scales, useful for identifying transient events.
- Trend Plot: Shows parameter changes over time, useful for monitoring machinery conditions.
- Time Base Orbit: Provides a two-dimensional view of rotor motion, essential for diagnosing issues like unbalance or misalignment.
- FFT Spectrum: Analyzes vibration frequencies to diagnose machine conditions, with options for harmonic and sideband analysis.
- Power Spectrum and PSD: Displays power distribution of signals, aiding in detailed analysis.
- Waterfall Plot: 3D plots showing vibration changes over time or speed variations.
- Ordered Spectrum and Orbit: Used for detailed order analysis, requiring shaft speed input.
- Machine Diagnosis: Includes calculators for belt, bearing, motor, and gearbox frequencies, aiding in precise diagnostics.
Catalog excerpts

Vibsens Vibration Monitoring System Datasheet Vibsens-PRO Condition Monitoring Software FEATURES ■/ Compatible with Vibsens measurement systems ✓ Supports VA-2000, V6000, V400 & VD-5 measurmentdevcies ■/ Automatic signal measurement and recording ■/ Continuous alarm checking and event logging ■/ Online and offline data review and analysis ■/ User-friendly and simple to use software ■/ Micorsoft® Excel report ■/ Supports 32 & 64 bit versions of Windows® 7,8, 8.1, 10 & XP ■/ Support Server and Display Client Mode APPLICATIONS > Rotating machinery vibration measurement > Machinery fault analysis > Rigid & flexible shaft balancing > Structural modal analysis > Digitization and recording of continuous long-duration waveforms
Open the catalog to page 1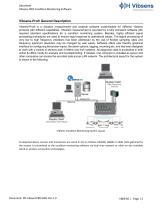
Datasheet Vibsens-PRO Condition Monitoring Software Vibsens Vibration Monitoring System Vibsens-Pro® General Description Vibsens-Pro® is a vibration measurement and analysis software customizable for different Vibsens products with different capabilities. Vibration measurement is provided by a fully compliant software with required standard specifications for a condition monitoring system. Besides, highly efficient signal processing procedures are used to ensure rapid response to operational issues. The signal processing of very low to high frequency vibrations has been addressed by the use of...
Open the catalog to page 2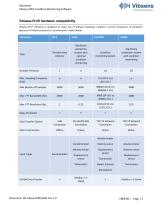
Vibsens Vibration Monitoring System Datasheet Vibsens-PRO Condition Monitoring Software Vibsens-Pro® software is designed to make use of VibSens hardware modules. A brief comparison of hardware features of VibSens products is summarized in table below.
Open the catalog to page 3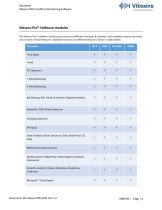
Datasheet Vibsens-PRO Condition Monitoring Software Vibsens-Pro® Software modules The Vibsens-Pro® software architecture consists of different functions & modules. Each hardware device can make use of some of these features. Available functions for different devices is shown in table below: Parameter Time Signal Ball Bearing, Belt, Motor & Gearbox Diagnosis Module Waterfall / PSD/ Power Spectrum Envelope Spectrum Order Analysis (Order Spectrum, Orbit, Bode Polar, DC Gap) Modal analysis ( Mag-Phase, Real-Imaginary, Nyquist, Coherence) Acoustic analysis ( Octave, Sharpness, Roughness, Loudness)
Open the catalog to page 4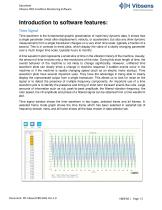
Vibsens Vibration Monitoring System Datasheet Vibsens-PRO Condition Monitoring Software Introduction to software features: Time Signal Time waveform is the fundamental graphic presentation of machinery dynamic data. It shows how a single parameter (most often displacement, velocity, or acceleration, but also any other dynamic measurement) from a single transducer changes on a very short time scale, typically a fraction of a second. This is in contrast to trend plots, which display the value of a slowly changing parameter over a much longer time scale, typically hours to months. A time waveform...
Open the catalog to page 5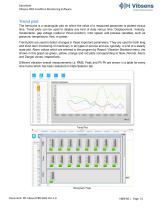
Datasheet Vibsens-PRO Condition Monitoring Software Trend plot The trend plot is a rectangular plot on which the value of a measured parameter is plotted versus time. Trend plots can be used to display any kind of data versus time: Displacement, Velocity, Acceleration, gap voltage (radial or thrust position), rotor speed, and process variables, such as pressure, temperature, flow, or power. Trend plots are used to detect changes in these important parameters. They are used for both long and short term monitoring of machinery in all types of service and are, typically, a kind of a steady state...
Open the catalog to page 6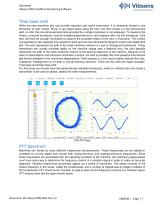
Datasheet Vibsens-PRO Condition Monitoring Software Time base orbit While the time waveform plot can provide important and useful information, it is inherently limited to one dimension of rotor motion. Since, in any lateral plane along the rotor, the rotor moves in a two-dimensional path, or orbit, this one-dimensional picture provided by a single transducer is not adequate. To measure this motion, a second transducer must be installed perpendicular to, and coplanar with, the first transducer. Only then will there be enough information to observe the complete motion of the rotor in that plane....
Open the catalog to page 7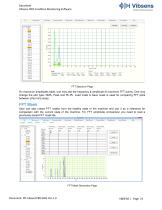
Datasheet Vibsens-PRO Condition Monitoring Software On maximum amplitudes table, one may see the frequency & amplitude of maximum FFT points. One may change the plot type: RMS, Peak and Pk-Pk. Load mask & Save mask is used for comparing FFT plots between other time steps. FFT Mask User can also create FFT masks from the healthy state of the machine and use it as a reference for comparison with the current state of the machine. For FFT amplitude comparison you need to load a previously saved FFT mask file. FFT Mask Generation Page
Open the catalog to page 8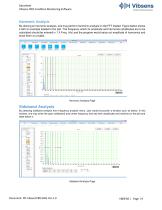
Datasheet Vibsens-PRO Condition Monitoring Software Harmonic Analysis By clicking on harmonic analysis, one may perform harmonic analysis on the FFT loaded. Figure below shows it with an example loaded to the plot. The frequency which its amplitude and harmonics amplitudes are to be calculated should be entered in 1 X Freq. (Hz) and the program would seize out amplitude of harmonics and show them on a table. Harmonic Analysis Page Sideband Analysis By selecting sideband analysis from frequency analysis menu, user would encounter a window such as below. In this window, one may enter the span (sideband)...
Open the catalog to page 9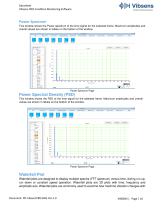
Datasheet Vibsens-PRO Condition Monitoring Software Power Spectrum This window shows the Power spectrum of the time signal for the selected frame. Maximum amplitudes and overall values are shown in tables on the bottom of the window. Power Spectrum Page Power Spectral Density (PSD) This window shows the PSD of the time signal for the selected frame. Maximum amplitudes and overall values are shown in tables on the bottom of the window. Power Spectrum Page Waterfall Plot Waterfall plots are designed to display multiple spectra (FFT spectrum) versus time, during run up, run down or constant speed...
Open the catalog to page 10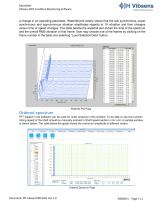
Datasheet Vibsens-PRO Condition Monitoring Software a change in an operating parameter. Waterfall plot clearly shows that the sub synchronous, super synchronous and asynchronous vibration amplitudes regards to 1X vibration and their changes versus time or speed changes. The table beside the waterfall plot shows the time of the spectrum and the overall RMS vibration of that frame. User may choose one of the frames by clicking on the frame number in the table and selecting “Load Selected Data” button. Waterfall Plot Page Ordered spectrum FFT loaded in the software can be used for order analysis...
Open the catalog to page 11All Vibsens catalogs and technical brochures
 V6000
V60002 Pages



- Calibration system
- Portable calibrator
- Measurement monitoring module
- Continuous monitoring module
- Digital monitoring module
- Remote monitoring module
- Vibration analyzer
- Compact calibration equipment
- Online monitoring module
- Vibration monitoring device
- Ethernet monitoring module
- Modbus monitoring module
- Machine monitoring module
- Portable vibration meter
- RS-485 monitoring module
- Machine monitoring vibrometer
- Modular monitoring module
- Hand-held calibrator
- Machine condition monitoring system