
- Catalogs
- Trimble Navigation - Construction Division
- Trimble Lifting Dashboard_Quick-Start-Guide_03312010_EN


Trimble Lifting Dashboard_Quick-Start-Guide_03312010_EN

Trimble Lifting Dashboard_Quick-Start-Guide_03312010_EN
Catalog excerpts
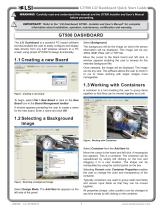
GT500 LSI Dashboard Quick Start Guide ! WARNING! Carefully read and understand this manual and the GT500 Installer and User’s Manual before proceeding. IMPORTANT! Refer to the “LSI Dashboard GT500 - Installer and User’s Manual” for complete information about installation, operation, maintenance, certification and warranty. GT500 DASHBOARD The LSI Dashboard is a powerful PC based software tool that enables the user to easily configure and display data directly from any LSI wireless sensors to a PC screen using simple WYSIWYG design functionality. Select Background. The background will be the image on which the sensor information will be displayed. This image can be any JPEG, BMP, PNG, GIF or TIFF file. Move the cursor to the blank board and left click. A window appears enabling the user to browse for the intended background file. Once selected, the image will be displayed. The image can be any size. The software allows the user to zoom in or out to make working with larger images more manageable. 1.3 Working with Containers A container is a tool enabling the user to group items together so that they can be moved together as a unit. Figure: Creating a new board To begin, select File > New Board or click on the New Board icon in the Board Management toolbar. A window appears prompting the user to create a name for the new board. Enter a name and click OK. 1.2 Selecting a Background Image Figure: Working with Containers Select Container from the Add Item list. Move the cursor to the board and left click. A rectangular box appears. This is a container. The container can be repositioned by simply left clicking on the box and dragging it to a new location. The shape can be manipulated by using the control points on the box. Selecting Format under Container Properties enables the user to change the color and transparency of the container. Typically containers are used to group static text fields and sensor input fields so that they can be moved together. Figure: Selecting a background image Select Design Mode. The Add Item list appears on the left side of the panel. All properties (shape, color, position) can be changed at any time simply by left clicking on the container.
Open the catalog to page 1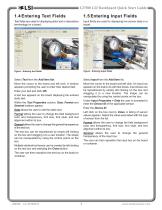
GT500 LSI Dashboard Quick Start Guide 1.4 Entering Text Fields 1.5 Entering Input Fields Text fields are used for displaying static text or descriptive terminology on a board. Input fields are used for displaying live sensor data on a board. Figure: Entering text fields Figure: Entering Input fields Select Text from the Add Item list. Select Input from the Add Item list. Move the cursor to the board and left click. A window appears prompting the user to enter their desired text. Move the cursor to the board and left click. An input box appears on the board. As with text boxes, input boxes can...
Open the catalog to page 2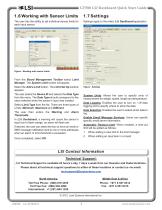
GT500 LSI Dashboard Quick Start Guide 1.6 Working with Sensor Limits The user has the ability to set individual sensor limits for each input sensor. Settings apply to the entire LSI Dashboard application. Figure: Working with sensor limits From the Board Management Toolbar select Limit Manager. The System Limit screen will appear. Select the Add a Limit button. The Limit Set Up window appears. Figure: Settings The user enters the Device ID and selects the Data Type from the menu. The Data Type should correspond to the value selected when the sensor’s input was created. System Units: Allows the...
Open the catalog to page 3All Trimble Navigation - Construction Division catalogs and technical brochures
 AArdvArk dr+GPS
2 Pages
 Trimble DiNi
2 Pages
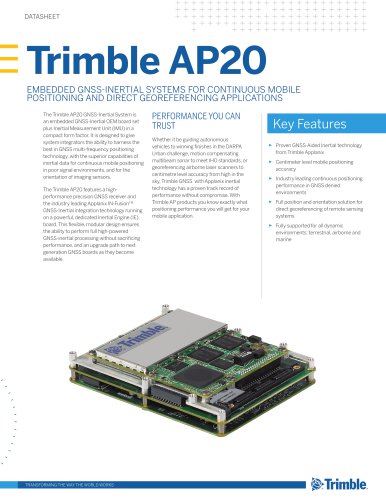 Trimble AP20
2 Pages
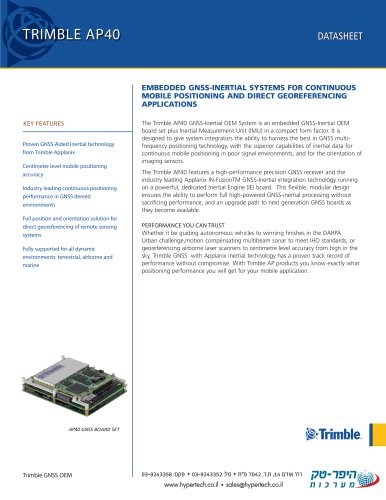 TRIMBLE AP40
2 Pages
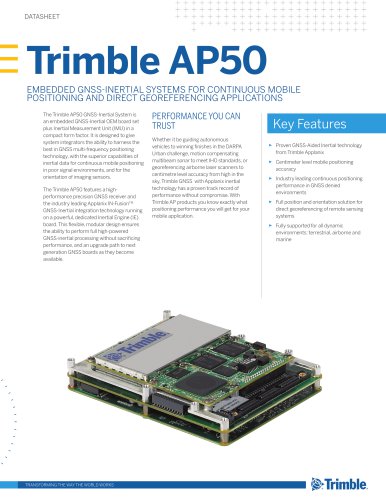 Trimble AP50
2 Pages
 DPS900 DRILLING SYSTEM
4 Pages
 TRIMBLE ASPHALT PAVING SOLUTIONS
16 Pages
 Trimble Earthworks Solutions
5 Pages
 User Guide TDL450 L&H - English
33 Pages
 TRACKER RFID SYSTEM
2 Pages
 Datasheet Trimble SCS900
2 Pages
 TRIMBLE TSC3 CONTROLLER
2 Pages
 Business Center - HCE
12 Pages
 Acutime Gold
2 Pages




Archived catalogs
 Trimble S6 - English
8 Pages
 SPL Distributor
28 Pages
 Spectra Precision Master
92 Pages
 Paving Solutions Brochure
5 Pages
 Asphalt Paving Brochure
16 Pages
 DPS900 Piling
4 Pages
 SPS882 User Guide, 4.00A
132 Pages
 COPERNICUS II GPS RECEIVER
2 Pages
 TSC2 Datasheet
2 Pages


- Force sensor
- LCD screen
- Industrial monitor
- Management software solution
- Automation software solution
- Tension/compression force transducer
- Panel-mount screen
- Real-time software
- Computer-aided design software
- USB monitor
- Cloud-based software
- Control software
- Touch screen tablet
- Design software solution
- Monitoring software solution
- Rugged tablet
- Weighing force transducer
- 3D software solution
- Communication gateway
- Measurement software