
- Catalogs
- THERMO FISHER SCIENTIFIC - MATERIALS SCIENCE
- Thermo Scientific Prisma E SEM Brochure


- Company
- Products
- Catalogs
- News & Trends
- Exhibitions
Thermo Scientific Prisma E SEM Brochure

Thermo Scientific Prisma E SEM Brochure
Energy Dispersive X-ray Spectroscopy (EDS) is a technique used in scanning electron microscopes (SEM) for analyzing the composition of microscopic samples. It is known for its sensitivity, precision, non-destructive nature, minimal sample preparation, and quick analysis. ChemiSEM Technology enhances this by integrating elemental analysis with electron imaging in real-time, improving usability and speed.
- Real-time imaging and chemical composition analysis.
- Single-click point and area compositional analyses.
- Elemental or phase distribution mapping across samples.
EDS captures X-rays emitted by elements in a sample, converting them into electrical signals to create an X-ray spectrum. Automated software identifies elements and calculates their concentrations, considering factors like absorption and fluorescence.
The EDS detector uses a silicon drift detector (SDD) cooled to reduce noise and improve performance. It includes a collimator and electron trap to prevent stray X-rays and electrons from affecting the sensor.
ChemiSEM Technology uses digital pulse processing to convert voltage signals into X-ray spectra, focusing on resolution, accuracy, and stability. Adaptive shaping time optimizes analysis speed and accuracy.
ChemiSEM Technology integrates EDS detectors with electron microscopes, allowing for short dwell times and reduced beam dose, mitigating surface damage.
Qualitative analysis identifies elements present in a sample above the detection limit. ChemiSEM Technology automates this process, using algorithms for accurate peak identification.
The accelerating voltage affects spatial resolution and X-ray excitation efficiency. Higher voltages lead to deeper electron penetration, reducing spatial resolution but enhancing X-ray excitation.
ChemiSEM Technology adapts to varying accelerating voltages, providing reliable results across different kV settings. Lower beam energies yield high-resolution results, useful for analyzing nanoparticles.
This involves identifying elements and their concentrations, removing background noise, deconvoluting overlapping peaks, and calculating elemental concentrations. ChemiSEM Technology streamlines this process by integrating it directly into the microscope image.
Background noise is removed using modeling or digital peak filtering, while overlapping peaks are separated using mathematical deconvolution routines.
Matrix corrections account for atomic number, absorption, and X-ray-induced fluorescence. The PROZA algorithm enhances quantification accuracy, especially for light elements. K-ratios compare X-ray counts in the sample to those in a known standard.
ChemiSEM Technology employs a standardless approach, using an internal database of experimental standards to interpolate peak intensities and calculate element concentrations.
ChemiSEM Technology offers point mode, linescan, and X-ray mapping for combining spatial and spectral information, providing comprehensive compositional insights.
X-ray mapping shows how elemental composition varies in two dimensions across a sample, with each pixel acquiring a full spectrum for detailed spectral imaging.
ChemiSEM Technology applies quantitative analysis to each pixel in a spectral image, removing background noise and correcting for matrix effects for accurate atomic and weight percentages.
This approach integrates EDS data with electron scanning to provide color-coded chemical composition maps, enhancing speed and accuracy. Algorithms select and blend colors for improved legibility and contrast.
ChemiSEM Technology includes a shadow detection system to eliminate false X-rays from shadowed regions, enhancing the accuracy of SEM-EDS analysis.
Examples include the analysis of contaminants in float glass and a garnet-rich gneiss sample, demonstrating the technology's ability to reveal compositional information and guide further analysis.
The technology enables fully quantitative X-ray elemental maps to be acquired quickly, allowing analysis over multiple fields of view. The Navigation Montage feature collects multiple images to form a single image, significantly reducing acquisition time.
The montage tool helps identify key textural and chemical relationships, providing comprehensive information on chemical variability within grains. It guides quantitative data acquisition through point analysis and linescans.
Acquisition parameters include an accelerating voltage of 15 kV, probe current of 4.1 nA, pixel dwell time of 800 ns, and magnification of 200x per frame.
ChemiSEM Technology offers accurate visualizations of chemical variations, aiding geologists in selecting precise locations for further measurements and developing datasets for thermobarometric estimates.
The document cites works by E. Gatti and P. Rehak on semiconductor drift chambers and a book on scanning electron microscopy and X-ray microanalysis by Goldstein et al.
Catalog excerpts

State-of-the-art EDS An introduction to elemental analysis with ChemiSEM Technology
Open the catalog to page 1
Spectral Analysis Introduction Energy dispersive X-ray spectroscopy (EDS) in the scanning electron microscope (SEM) is one of the easiest methods for analyzing the composition of microscopic samples. • Sensitive to low concentrations—minimum detection limits below 0.1% in the best cases • Affords a high degree of relative precision — typically 2-4% • Nondestructive in most situations • Requires minimal sample preparation effort and time • Delivers complete analyses of complex samples quickly, often in under a minute Thermo Scientific™ ChemiSEM Technology offers a leap forward in usability, convenience,...
Open the catalog to page 2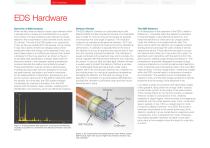
Spectral Analysis EDS Hardware Overview of EDS Analysis When excited under an electron beam, each element within a sample emits a unique and characteristic X-ray signal. The number of X-rays emitted by each element is loosely related to the concentration of that element and its atomic (Z) number. The role of the EDS system is to capture the X-rays as they are emitted from the sample, convert these X-rays into a series of electrical voltage pulses whose amplitudes reflect the energy of the detected X-rays, and pass these pulses to a multichannel analyzer that creates a histogram of the X-ray spectrum...
Open the catalog to page 3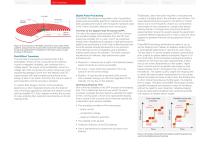
Spectral Analysis Digital Pulse Processing ChemiSEM Technology incorporates a set of proprietary digital pulse processing algorithms, tailored to provide the best possible performance with the specific hardware used in the Thermo Scientific detectors and microscopes. Figure 3: Cross section of the SDD. Concentric rings create a field gradient, along which the charge drifts towards the small collection anode and integrated FET integrated on the back surface. Image courtesy of PN sensor. Field Effect Transistor The next step in the signal-processing chain is the preamplifier, where current conducted...
Open the catalog to page 4
Electron Beam Synchronization and Minimum Dwell Times For a traditional “discrete” EDS system, the final step of the EDS hardware chain is to correlate the electron beam position with the X-ray spectrum generated at that position. Positioning of the beam is done through an external beam control interface in a support box. This controls the microscope beam position via an analog control interface. Additionally, column, beam, and stage parameters must be read through an external digital interface between the support PC running the EDS software and the PC that runs the microscope. Each of these...
Open the catalog to page 5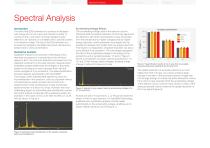
Spectral Analysis Spectral Analysis Qualitative Analysis Qualitative analysis is the process of identifying which elements are present in a sample above the minimum detection limit. The minimum detection limit arises from the statistical uncertainty of the peak intensity measurements.2 Qualitative analysis determines the energies of the peaks present in the spectrum and compares them with the known energies of X-ray emissions. This peak identification process happens automatically with ChemiSEM Technology, where sophisticated algorithms check for inconsistencies in the spectrum, such as a kβ...
Open the catalog to page 6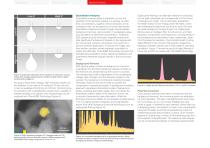
Figure 8: Schematic depiction of the variation of interaction volume shape with average sample atomic number (Z) and electron beam accelerating voltage kV. By using a lower beam energy, high-resolution results can be obtained. In the case of Pt excited at 10 keV, the only X-ray line available is the M-line at 2.05 keV. Combining lowkV excitation with a quantification engine that is capable of reliably handling such signals, even nanoparticles can be analyzed with ChemiSEM Technology (Figure 9). Spectral Analysis Quantitative Analysis Quantitative analysis seeks to establish not only the identities...
Open the catalog to page 7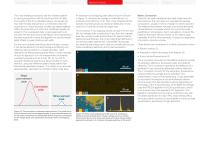
The most reliable procedures add the models together in varying proportions until the result best fits the data. The quality of this fit is evaluated using a chi-square (χ2) test, with the idea being that χ2 is minimized when the proportions in which the peak models are added together reflect the proportions in which the constituent peaks are present in the overlapped data. A good approach is to consider the first and second derivatives of the standards in the least square fit to allow the algorithm to accommodate slight offsets in peak positions and width. For the most reliable peak-fitting...
Open the catalog to page 8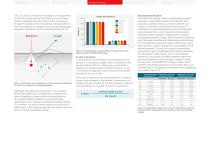
Spectral Analysis The Z, A, and F correction terms depend on the geometry of both the sample and the EDS detector. Each of these terms is integrated along the path that the X-ray travels through the sample and to the detector. Miscalculations in the X-ray pathway, for example, due to sample topography, represent a significant source of uncertainty (Figure 14). Pathlength calculations are automatic in most modern SEM-EDS systems and consider beam conditions (kV, beam deceleration), stage position (working distance, tilt), and EDS detector position to provide accurate quantification over a range...
Open the catalog to page 9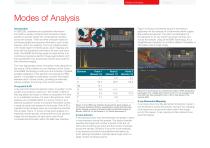
Spectral Analysis Modes of AnalysisIntroduction In SEM EDS, qualitative and quantitative information from EDS is usually combined with the electron beam position to provide insight into compositional variation across the sample. There are three principle modes for combining spatial and spectral information: point mode, linescan, and X-ray mapping. The X-ray mapping starts with simple region-of-interest gross count mapping and ends with full quantitative information for each and every pixel. ChemiSEM Technology goes one step further and combines progressive electron image segmentation with fully...
Open the catalog to page 10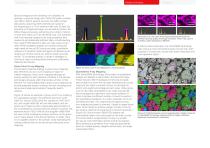
Spectral images are the extremely rich datasets; for example, a spectral image with 1024x1024 pixels contains one million distinct spectra and over two billion unique data points, assuming 2048 channels per spectrum (corresponding to a 10 eV channel width over 20 keV). By acquiring a full spectral image, you are able to perform full offline image processing, extracting any number of points or lines from within an X-ray elemental map. The drawback with X-ray spectral imaging is the long acquisition time needed to get statistically sufficient data, notwithstanding that modern EDS detectors offer...
Open the catalog to page 11All THERMO FISHER SCIENTIFIC - MATERIALS SCIENCE catalogs and technical brochures
 Axia ChemiSEM
23 Pages
 ChemiSEM Technology
18 Pages
 V400ACE
2 Pages
 Phenom XL G2 Desktop SEM
6 Pages
 Helios 5 Laser Hydra System
4 Pages
 Phenom Pharos G2
4 Pages
 Helios 5 CX DualBeam
4 Pages
 Phenom Pure G6 Desktop SEM
4 Pages
 Phenom ParticleX TC
6 Pages
 Phenom ParticleX Steel
6 Pages
 ChemiSEM Technology
3 Pages






Archived catalogs
 Titan? ETEM G2
4 Pages
 Scios for Materials Science
4 Pages
 Talos
2 Pages
 V400ACE Focused Ion Beam
2 Pages

- Thermo Fisher automation software
- Thermo Fisher analysis software
- Process software
- Real-time software
- Computer-aided design software
- Cloud-based software
- Control software
- Spectrometer
- Design software solution
- Industrial software
- 3D software solution
- Measurement software
- Interface software
- Visualization software solution
- Thermo Fisher laboratory microscope
- Quality software
- Programming software solution
- Development software