
- Catalogs
- THERMO FISHER SCIENTIFIC - MATERIALS SCIENCE
- Malachite characterization with Axia ChemiSEM


- Company
- Products
- Catalogs
- News & Trends
- Exhibitions
Malachite characterization with Axia ChemiSEM
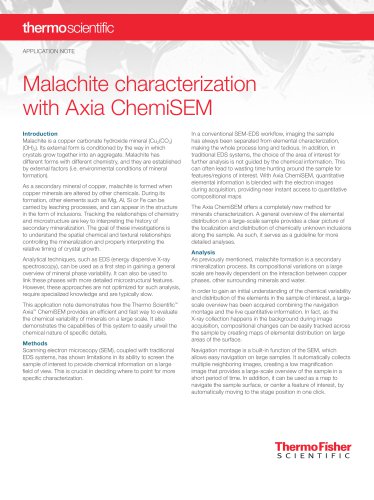
Malachite characterization with Axia ChemiSEM
Malachite is a copper carbonate hydroxide mineral formed through secondary mineralization processes. Its formation involves the alteration of copper minerals by other chemicals, often incorporating elements like Mg, Al, Si, or Fe. Understanding the chemical and microstructural relationships in malachite is crucial for interpreting its mineralization history.
Methods
Traditional SEM-EDS systems have limitations in providing chemical information over large areas. The Thermo Scientific™ Axia™ ChemiSEM integrates EDS with SEM imaging, allowing for real-time quantitative elemental mapping. This integration facilitates a more efficient workflow by providing immediate compositional maps during image acquisition.
Analysis
The Axia ChemiSEM system allows for a comprehensive overview of elemental distribution in malachite samples. By using navigation montage, large-scale images are created, enabling easy navigation and identification of areas of interest. The system provides detailed compositional information, correlating morphological aspects with chemical data, which aids in selecting regions for further analysis.
Malachite Characterization with Axia ChemiSEM
The integration of EDS into the SEM interface allows for live acquisition and processing of elemental data. This approach provides a higher level of detail compared to conventional methods, enabling the identification of different phases and compositional differences within inclusions.
Conclusion
The Axia ChemiSEM offers a powerful tool for analyzing unknown inclusions in minerals like malachite. Its ability to combine wide-area imaging with high-quality EDS mapping makes it ideal for investigating chemical and textural processes efficiently, without the need for workflow changes or software switching.
Catalog excerpts
APPLICATION NOTE Malachite characterization with Axia ChemiSEM Introduction Malachite is a copper carbonate hydroxide mineral (Cu2(CO3) (OH)2). Its external form is conditioned by the way in which crystals grow together into an aggregate. Malachite has different forms with different chemistry, and they are established by external factors (i.e. environmental conditions of mineral formation). As a secondary mineral of copper, malachite is formed when copper minerals are altered by other chemicals. During its formation, other elements such as Mg, Al, Si or Fe can be carried by leaching processes, and can appear in the structure in the form of inclusions. Tracking the relationships of chemistry and microstructure are key to interpreting the history of secondary mineralization. The goal of these investigations is to understand the spatial chemical and textural relationships controlling the mineralization and properly interpreting the relative timing of crystal growth. Analytical techniques, such as EDS (energy dispersive X-ray spectroscopy), can be used as a first step in gaining a general overview of mineral phase variability. It can also be used to link these phases with more detailed microstructural features. However, these approaches are not optimized for such analysis, require specialized knowledge and are typically slow. This application note demonstrates how the Thermo Scientific™ Axia™ ChemiSEM provides an efficient and fast way to evaluate the chemical variability of minerals on a large scale. It also demonstrates the capabilities of this system to easily unveil the chemical nature of specific details. Methods Scanning electron microscopy (SEM), coupled with traditional EDS systems, has shown limitations in its ability to screen the sample of interest to provide chemical information on a large field of view. This is crucial in deciding where to point for more specific characterization. In a conventional SEM-EDS workflow, imaging the sample has always been separated from elemental characterization, making the whole process long and tedious. In addition, in traditional EDS systems, the choice of the area of interest for further analysis is not guided by the chemical information. This can often lead to wasting time hunting around the sample for features/regions of interest. With Axia ChemiSEM, quantitative elemental information is blended with the electron images during acquisition, providing near instant access to quantitative compositional maps The Axia ChemiSEM offers a completely new method for minerals characterization. A general overview of the elemental distribution on a large-scale sample provides a clear picture of the localization and distribution of chemically unknown inclusions along the sample. As such, it serves as a guideline for more detailed analyses. Analysis As previously mentioned, malachite formation is a secondary mineralization process. Its compositional variations on a large scale are heavily dependent on the interaction between copper phases, other surrounding minerals and water. In order to gain an initial understanding of the chemical variability and distribution of the elements in the sample of interest, a largescale overview has been acquired combining the navigation montage and the live quantitative information. In fact, as the X-ray collection happens in the background during image acquisition, compositional changes can be easily tracked across the sample by creating maps of elemental distribution on large areas of the surface. Navigation montage is a built-in function of the SEM, which allows easy navigation on large samples. It automatically collects multiple neighboring images, creating a low magnification image that provides a large-scale overview of the sample in a short period of time. In addition, it can be used as a map to navigate the sample surface, or center a feature of interest, by automatically moving to the stage position in one click
Open the catalog to page 1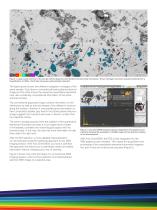
100 μm C O Mg Al Si P Cu K Figure 1. Large-scale overview of the sample without (top) and with (bottom) the elemental information. These montages have been acquired starting from a magnification of 1500x. 15x15 tiles have been automatically collected. The figure above shows two different navigation montages of the same sample. One shows a conventional backscattered electron image and the other shows the respective quantitative elemental map, also containing compositional information of the entire scanned surface. The conventional grayscale image contains information on the distribution (as well...
Open the catalog to page 2
A first overview of the elemental distribution is obtained by simply activating the quantitative elemental mapping after acquiring an image. It will show which elements are present in the area of interest (Figure 3). 10 μm Al C O Mg Al Si P Cu Figure 3. Quantitative elemental image of the area presented in Figure 2. Within the same acquisition, by deselecting some of the elements, we have the option to highlight that the composition of the inclusions in the image is not the same for all objects in the ROI (Figure 4). 10 μm Si Figure 5. From top to bottom: Al, Mg and Si distribution. The set of...
Open the catalog to page 3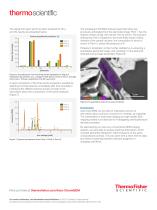
The signal from each point has been acquired for 60 s, and the results are presented below. Points quantification (atomic %) Point 1 Point 2 Point 3 The subsequent Point&ID analysis supported what was previously anticipated from the elemental image: Point 1 has the highest content of Mg, with almost 10% Al and Si. The inclusion analyzed by Point 3 appears to be (most likely) made of silica. Analysis of the central inclusion, the composition of which is shown in Point 2, shows the presence of K. Potassium localization is then further clarified by re-acquiring a quantitative elemental image, and...
Open the catalog to page 4All THERMO FISHER SCIENTIFIC - MATERIALS SCIENCE catalogs and technical brochures
 Axia ChemiSEM
23 Pages
 ChemiSEM Technology
18 Pages
 V400ACE
2 Pages
 Phenom XL G2 Desktop SEM
6 Pages
 Helios 5 Laser Hydra System
4 Pages
 Phenom Pharos G2
4 Pages
 Helios 5 CX DualBeam
4 Pages
 Phenom Pure G6 Desktop SEM
4 Pages
 Phenom ParticleX TC
6 Pages
 Phenom ParticleX Steel
6 Pages
 ChemiSEM Technology
3 Pages



Archived catalogs
 Titan? ETEM G2
4 Pages
 Scios for Materials Science
4 Pages
 Talos
2 Pages
 V400ACE Focused Ion Beam
2 Pages

- Thermo Fisher automation software
- Thermo Fisher analysis software
- Process software
- Real-time software
- Thermo Fisher microscope
- Computer-aided design software
- Cloud-based software
- Control software
- Spectrometer
- Design software solution
- Industrial software
- 3D software solution
- Measurement software
- Interface software
- Visualization software solution
- Thermo Fisher laboratory microscope
- Quality software
- Programming software solution
- Thermo Fisher automated software
- Development software