
- Catalogs
- THERMO FISHER SCIENTIFIC - MATERIALS SCIENCE
- ChemiSEM Technology


- Company
- Products
- Catalogs
- News & Trends
- Exhibitions
ChemiSEM Technology
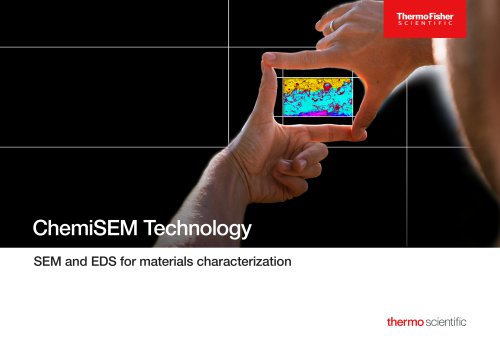
ChemiSEM Technology
ChemiSEM Technology integrates Scanning Electron Microscopy (SEM) and Energy Dispersive Spectroscopy (EDS) into a single interface, enhancing materials characterization by providing quick and reliable elemental information. It introduces ChemiPhase for identifying unique phases using a big data approach, reducing user bias and errors.
- Always On: Continuous EDS signal collection during SEM imaging.
- Faster Data Acquisition: Utilizes machine learning and ultrafast signal processing for rapid elemental information access.
- Reliable Results: Accurate qualification and quantification across various operating conditions.
- Complete Information: Comprehensive micro-scale elemental composition with immediate color results.
- Multi-data Viewing: SEM imaging and elemental information in a single frame.
- Simplified Operation: Accessible compositional results for a broader range of users.
ChemiSEM Technology offers a seamless SEM-EDS workflow with intuitive data management, quadrant format, and project tree for highlighting important data.
- View samples and switch between quantitative maps, count maps, and phase distribution maps.
- Generate full-color overlays from quantitative X-ray maps.
- Analyze areas using extract tools and manage data acquisitions in the project tree.
- View atomic% or weight% in quantitative maps.
ChemiSEM provides live compositional information with fast data processing, allowing rapid sample navigation and detailed quantitative analysis.
Automates acquisition over large areas, providing quantitative information and large-scale overviews for effective screening.
ChemiSEM uses PROZA Phi-Rho-Z matrix corrections for improved accuracy in light element analysis, with innovative algorithms for precise quantification.
Removes sum and escape peak artifacts, ensuring accurate results even at high count rates.
Uses iterative auto peak ID with adaptive digital filtering for resolving overlapping peaks, providing confidence in results.
Validates elemental identification and quantification based on exact microscope settings.
Supports analysis of compounds by stoichiometry for a complete sample picture.
- Point Analysis Mode: Full elemental information at any point or region.
- Linescan Mode: Chart compositional changes across samples.
ChemiSEM provides live peak deconvolution and accurate elemental analysis with advanced drift correction routines.
Identifies unique phases using advanced statistical analysis, providing a probability that each pixel belongs to a detected significant spectrum.
ChemiPhase offers a fully automated process for element identification, eliminating user bias and enabling the detection of minor and trace elements without extensive experience. It provides a comprehensive analysis by identifying major and minor components down to a single pixel and locating unique components even when peak overlaps occur. The technology allows for fast acquisition, requiring minimal X-ray data, and completes most acquisitions in under a minute, even for complex phase maps. It simplifies analysis by presenting a simple image-spectrum pair for each distinct phase and automatically optimizes spectra for confident analysis.
ChemiSEM Drift Compensation Software uses the Drift Compensated Frame Integration (DCFI) algorithm to monitor and adjust for sample drift, enabling high magnification operation and longer acquisition times. It offers the shortest dwell time EDS drift correction, operating in as little as 200 ns, and integrates seamlessly into the microscope control platform.
ChemiView Software provides comprehensive offline data processing and reporting functionality, allowing data to be saved and exported for post-processing on any device. It offers a range of options for data re-elaboration, color adjustment, and spectrum extraction, with a reporting function for customized data reports. ChemiSEM, ChemiSEM Advanced, and ChemiVIEW are available for Thermo Scientific Axia and Apreo 2 Microscopes.
The software suite integrates all SEM EDS functions in a single interface, supports project-based data storage, and offers industry-standard data formats. It includes features like automatic peak identification, spectral overlays, accurate quantification, and live quantitative mapping. The software supports compound analysis and offers drift compensation mapping based on DCFI.
Thermo Fisher Scientific provides extensive support through NanoPorts, offering tailored solutions and demonstrations. The My Microscope tool ensures quick response to instrument issues, and a global service network supports installation and maintenance. Financial and leasing services are available to overcome budgetary constraints, offering flexible financing options to support successful operations.
Thermo Fisher Scientific is a leader in serving science, providing innovative solutions for electron microscopy, surface analysis, and microanalysis. Their comprehensive portfolio supports a wide range of applications across various industries, combining high-resolution imaging with physical, chemical, elemental, mechanical, and electrical analysis.
Catalog excerpts
Thermo Fisher ChemiSEM Technology SEM and EDS for materials characterization thermo scientific
Open the catalog to page 1
Insert chemistry into the heart of your SEM workflow As materials research continues to advance, more and more researchers have begun using scanning electron microscopes (SEMs) for compositional analysis, and manufacturers have responded by equipping most SEMs with energy dispersive X-ray detectors (EDS). However, traditional EDS detectors are often purchased as separate systems, leaving some with disparate hardware and software solutions. Thermo Scientific™ ChemiSEM™ Technology revolutionizes and simplifies EDS analysis by fully integrating SEM and EDS functions into a single, cohesive user...
Open the catalog to page 2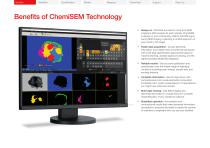
Quantification Modes Mapping ChemiView Support About us Benefits of ChemiSEM Technology Always on — Eliminate the need to move from SEM imaging to EDS analysis for each sample. ChemiSEM is always on and continuously collects the EDS signal during SEM imaging, collecting a full EDS spectrum at every point in the image. Faster data acquisition—Access elemental information much faster than conventional techniques with novel data segmentation approaches based on machine learning, ultrafast signal processing, and the tightest possible SEM EDS integration. Reliable results—Get accurate qualification...
Open the catalog to page 3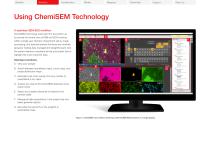
Mapping ChemiView Support About us Using ChemiSEM Technology A seamless SEM-EDS workflow ChemiSEM Technology was built from the bottom up to provide full control over all SEM and EDS functions within a single user interface. Experiment setup, image processing, and spectral analysis functions are intuitively grouped, making data management straightforward. And the system features a quadrant format and project tree to highlight the most important data. A. View your sample B. Switch between quantitative maps, count maps, and phase distribution maps C. Generate a full-color overlay from any number...
Open the catalog to page 4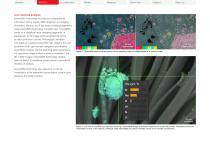
Live chemical analysis ChemiSEM Technology provides live compositional information during routine SEM navigation and imaging. Proprietary electron and X-ray data processing algorithms make ChemiSEM Technology incredibly fast. ChemiSEM works on a statistical basis, assigning segments, or superpixels, to the image which progressively shrink as data continues to arrive. This process ultimately converges on a pixel-precise EDS map, allowing the user to perform both rapid sample navigation and detailed quantitative analysis without switching setup parameters. For specimens where limited contrast is...
Open the catalog to page 5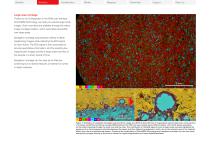
Large area montage Thanks to its full integration in the SEM user interface, ChemiSEM Technology can help you acquire large-scale images. Such overviews are available through the native image montage creation, which automates acquisition over large areas. Navigation montage automatically collects multiple neighboring images while collecting the EDS signal for each frame. The EDS signal is then processed to provide quantitative information, and the resulting lowmagnification images provide a large-scale overview of the sample in a short period of time. Navigation montage can be used as an effective...
Open the catalog to page 6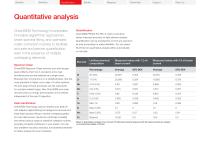
Mapping ChemiView Support Quantitative analysis ChemiSEM Technology incorporates innovative algorithmic approaches, smart spectral fitting, and optimized matrix correction routines to facilitate accurate and precise quantification, even in the presence of multiple overlapping elements. Spectrum Clean ChemiSEM Spectrum Clean removes sum and escape peak artifacts when two X-ray beams arrive near simultaneously and are detected as a single event. Because their occurrence is on a statistical basis, they are more prevalent at higher count rates. On other systems, the sum peak removal processes can...
Open the catalog to page 7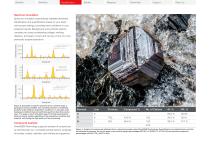
Spectrum simulation Spectrum simulation automatically validates elemental identification and quantification based on your exact microscope settings, providing total confidence in your analytical results. Background and synthetic spectra consider your exact accelerating voltage, working distance, and beam current and can be run live or to any Intensity (counts) previously acquired spectrum. O Ceramic (7 786 984 counts) Background spectrum Synthetic spectrum Intensity (counts) Background spectrum Synthetic spectrum Intensity (counts) Geological section (879 643 counts) Malachite (4 401 106 counts)...
Open the catalog to page 8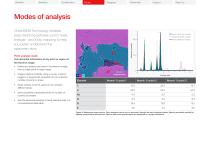
ChemiView Support Modes of analysis ChemiSEM Technology enables easy switching between point mode, linescan, and X-ray mapping to help you better understand the specimen story. Full elemental information at any point or region on the electron image: • Define and analyze any area in the electron image, from a single point to larger areas • Analyze regions instantly using a survey mode or toggle to a sequenced acquisition for an unlimited number of points or areas • Easily overlay a point's spectrum to compare different areas • Save acquisition parameters (time or number of counts) as presets •...
Open the catalog to page 9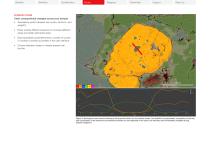
ChemiView Support Linescan mode Chart compositional changes across your sample: • Seamlessly switch between net counts, atomic%, and weight% • Easily overlay different linescans to compare different areas and obtain elemental ratios • Save acquisition parameters (time, number of counts, or number of points) as presets in the user interface • Choose between single or multiple passes over the line Figure 9. Geological cross section showing a silica particle within an iron sulfide cluster. The definition of parameters, acquisition of the line, and visualization of the elements and elemental profiles...
Open the catalog to page 10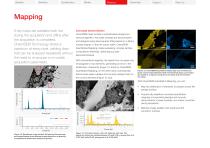
Mapping X-ray maps are available both live during the acquisition and offline after the acquisition is completed. ChemiSEM Technology stores a spectrum at every pixel, yielding data that can be analyzed repeatedly without the need to re-acquire or re-create acquisition parameters. 1 Live peak deconvolution ChemiSEM maps include a sophisticated background removal algorithm. Any peak overlaps are deconvoluted and assigned using least squares fitting based on a library of peak shapes. In the net counts realm, ChemiSEM Quantitative Mapping makes evaluating complex sample With conventional mapping,...
Open the catalog to page 11All THERMO FISHER SCIENTIFIC - MATERIALS SCIENCE catalogs and technical brochures
 Axia ChemiSEM
23 Pages
 V400ACE
2 Pages
 Phenom XL G2 Desktop SEM
6 Pages
 Helios 5 Laser Hydra System
4 Pages
 Phenom Pharos G2
4 Pages
 Helios 5 CX DualBeam
4 Pages
 Phenom Pure G6 Desktop SEM
4 Pages
 Phenom ParticleX TC
6 Pages
 Phenom ParticleX Steel
6 Pages
 ChemiSEM Technology
3 Pages



Archived catalogs
 Titan? ETEM G2
4 Pages
 Scios for Materials Science
4 Pages
 Talos
2 Pages
 V400ACE Focused Ion Beam
2 Pages

- Thermo Fisher automation software
- Thermo Fisher analysis software
- Process software
- Real-time software
- Computer-aided design software
- Cloud-based software
- Control software
- Spectrometer
- Design software solution
- Industrial software
- 3D software solution
- Measurement software
- Interface software
- Visualization software solution
- Thermo Fisher laboratory microscope
- Quality software
- Programming software solution
- Thermo Fisher automated software
- Development software