- Catalogs
- Teledyne LeCroy Europe
- Vehicle Bus Analyzers
Vehicle Bus Analyzers

Vehicle Bus Analyzers
The document provides detailed information about the Vehicle Bus Analyzer (VBA) and its capabilities in analyzing CAN, FlexRay, and LINbus protocols. It highlights the features, specifications, and ordering information for various models of the analyzer.
Key Features
- Symbolic decoding of up to four CAN buses at the application layer.
- CAN triggering and digital data extraction with symbolic format setup.
- Automated timing measurements and compatibility with CAN DBC database format.
- Support for FlexRay and LINbus protocols, including physical layer testing and eye diagram mask testing.
- Ability to capture thousands of messages with up to 25 Mpts of memory.
Vehicle Bus Analyzer Capabilities
- Decodes CAN serial data into symbolic text directly on the oscilloscope display.
- Allows viewing of CAN messages, signals, and physical layer data alongside other analog/digital signals.
- Facilitates fast debugging with direct symbolic decoding and triggering.
- Enables timing measurements across gateways and statistical analysis of event timing.
Specifications and Ordering Information
- Various models available with different bandwidths and channel configurations.
- Includes powerful LeCroy WaveRunner Xi-A Series oscilloscope software for CANbus, FlexRay, and LINbus analysis.
- Options for mixed signal oscilloscope and high-voltage differential probes.
Customer Service and Warranty
- LeCroy oscilloscopes and probes come with a three-year warranty for oscilloscopes and a one-year warranty for probes.
- Includes no charge for return shipping, long-term support, and free software upgrades.
Unique Measurement Tools
- The VBA can extract CAN digital data, plot it as an analog signal, and compare it to other electrical signals.
- Provides graphical plotting of data such as steering angle and rate of change as time-correlated tracks.
Catalog excerpts
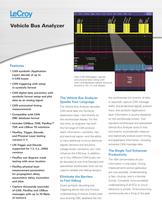
• CAN triggering with setup • CAN digital date extraction with symbolic format setup and plot data as an analog signal • Includes CANbus TDM, FlexRay™ • FlexRay, Trigger, Decode, and Physical Layer testing • FlexRay eye diagram mask testing with error location • FlexRay physical layer measurement parameters asymmetric delay, truncation * Capture thousands (seconds) messages with up to 25 Mpts View CAN Messages, signals, and physical layer along with other analog/digital signals (sensors, Speaks Your Language The Vehicle Bus Analyzer decodes CAN serial data into Symbolic (application layer ) text directly on first time, an engineer has both the full range of CAN protocol and electrical signal—and the ability to view additional in-circuit electrical signals (sensors and actuators, voltage levels, transients, etc.) that up to four different CAN buses can specialized oscilloscope tools can be used to validate and debug designs. Direct symbolic decoding and triggering allows fast and intuitive understanding of events.Simply load your existing DBC database file into the oscilloscope (no re-entry of data is required); capture CAN message traffic; and all electrical (signal), protocol layer information is quickly displayed standard oscilloscope and specialized Vehicle Bus Analyzer tools to find rare events, automatically measure and statistically analyze event timing, and graph/plot information, including extracted CAN message data. The Single Tool Enhances information in one place. Timing measurements across gateways is fast, intuitive, and in a familiar format. Complete, time-correlated behaviors is simple. Time-consuming workarounds are a thing of the past.
Open the catalog to page 1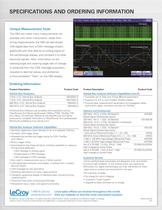
SPECIFICATIONS AND ORDERING INFORMATION Unique Measurement Tools The VBA can make many measurements not possible with other instruments. Aside from timing measurements, the VBA can also extract CAN digital data from a CAN message stream, graphically plot that data as an analog signal on the oscilloscope display, and compare it to other electrical signals. Here, information on the steering angle and steering angle rate of change is extracted from the CAN message acquisition, rescaled to decimal values, and plotted as a time-correlated "Track" on the VBA display. Ordering Information Product Description...
Open the catalog to page 2All Teledyne LeCroy Europe catalogs and technical brochures
 T3DSO4000L-HD
19 Pages
 WaveRunner 8000HD
20 Pages
 HDO6000B
20 Pages
 T3DSOH1000 /T3DSOH1000-ISO
15 Pages
 T3DAQ1-16
16 Pages
 T3MIL50 Milli Ohm Meter
6 Pages
 T3PM1006 Digital Power Meter
8 Pages
 Current Probes
4 Pages
 WavePro HD
20 Pages
 WaveRunner 9000
20 Pages
 PeRT3 Phoenix System
16 Pages
 DDR Test Suite
12 Pages
 LabMaster 10 Zi-A
28 Pages
 WaveRunner 8000
24 Pages
 wavesurfer 510
20 Pages
 MDA800 Motor Drive Analyzers
8 Pages
 MIPI M-PHY Protocol Analyzer
4 Pages
 Transmission Line Probes
2 Pages
 WaveSurfer 10 Oscilloscope
12 Pages
 Summit T24 Analyzer
2 Pages
 SierraNet M168
4 Pages
 LabMaster 10 Zi Oscilloscopes
36 Pages
 LabMaster 9 Zi-A Oscilloscopes
36 Pages
 WaveMaster 8 Zi-A Oscilloscopes
36 Pages
 SDA 8 Zi-A Serial Data Analyzers
36 Pages
 DDA 8 Zi-A Disk Drive Analyzers
36 Pages
 WavePro 7 Zi-A Oscilloscopes
28 Pages
 SDA 7 Zi-A Serial Data Analyzers
28 Pages
 DDA 7 Zi-A Disk Drive Analyzers
28 Pages
 HRO 12-bit Oscilloscopes
8 Pages
 HDO8000 High Definition
20 Pages
 HDO6000 / HDO6000-MS High
20 Pages
 WaveRunner 6 Zi Oscilloscopes
28 Pages


Archived catalogs
 HDO4000 / HDO4000-MS High
16 Pages
 Summit T3-16 Analyzer
2 Pages
 Voyager M3i
8 Pages
 WaveSurfer 3000 Oscilloscopes
12 Pages
 WaveJet 300A Oscilloscopes
8 Pages
 Differential Amplifiers
2 Pages
 Current Probes
7 Pages
 HFP SERIES ACTIVE PROBES
4 Pages
 LeCroy Kibra 480 Analyzer
4 Pages
 Signal Integrity Studio
4 Pages
 ArbStudio
8 Pages
 PeRT3 Eagle System
8 Pages
 SPARQ
SPARQ12 Pages
 LogicStudio
8 Pages


- Power supply unit
- DC power supply
- Concentration analyzer
- Automatic analyser
- Single-output power supply
- Benchtop analyser
- Portable analyzer
- Generator
- Digital analyzer
- Multimeter
- Digital multimeter
- Power quality analyzer
- Programmable power supply
- Power meter
- DC/DC power supply
- Data acquisition unit
- High-performance analyzer
- Trace analyzer
- Electrical network analyzer
- 1000 V multimeter