H500/SA2500 Handheld Spectrum Analyzer
1 /14Pages

H500/SA2500 Handheld Spectrum Analyzer
1 /14Pages
Catalog excerpts

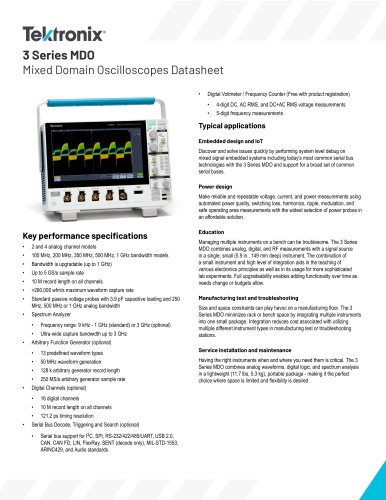
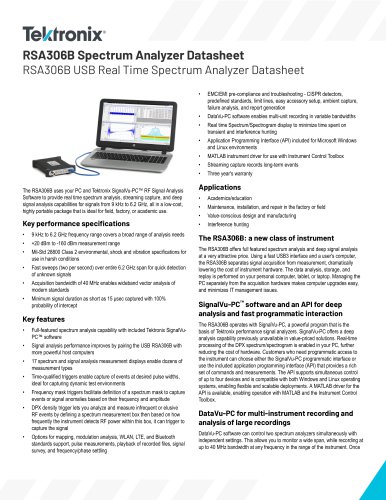
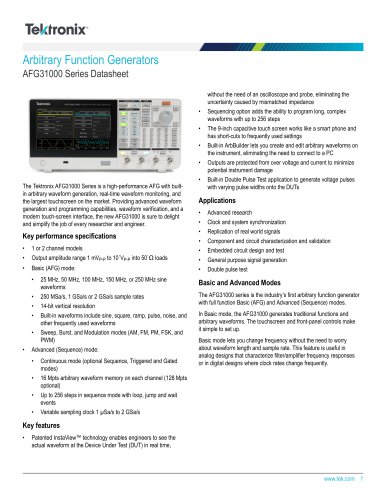
H500 / SA2500 Spectrum Analyzer Datasheet Locate Rapid targeting of signals with field-proven signal hunting, mapping, and documentation tools Hunt outdoor signals with built-in GPS receiver by plotting measurements directly into GPS geo-referenced maps such as Pitney Bowes Mapinfo, Google™ Earth, Microsoft® MapPoint®, Bitmap, and many others Improved spectrum awareness with high-accuracy measurement synchronization and time stamping Hunt in-building signals with a single-touch Tap-and-Walk-and-Tap interface The H500 and SA2500 will quickly scan the RF environment, classify the known signals, and help you locate the unknown signals with their fieldproven signal hunting tools. Featuring real-time DPX™ Live RF spectrum display technology, the H500 and SA2500 offer practical solutions for discovering transient events that slip past conventional spectrum analyzers. The H500 and SA2500 are a great choice for general-purpose spectrum measurements and ideal signal-hunting tools. Key features Scan Revolutionary DPX™ Live RF spectrum display technology with DPX Spectrum Mask provides intuitive understanding of live RF signals using colors based on frequency of occurrence, processing up to 10,000 spectrums/sec with a 100% Probability of Intercept (POI) to capture pulsed signals, radar emissions, hopping signals, and any other intermittent signals with a minimum duration as brief as 125 μs Benchtop spectrum analyzer performance in a ruggedized handheld battery-operated field unit offers better than 70 dB spurious free dynamic range (SFDR), guaranteed ≤ -95 dBc/Hz at 10 kHz offset phase noise specifications from 10 kHz to 6.2 GHz Excellent sensitivity for detecting very low-level signals with -153 dBm DANL at 10 Hz RBW (equivalent to -163 dBm/Hz) such as RF bugs and unauthorized transmitters LAN interface for remote control and unattended monitoring stations for spectrum awareness Classify Built-in classification capability for WLAN, GSM, W-CDMA, CDMA, ATSC signals makes quick and simple identification of legitimate signals Flexibility to edit, upgrade, and share signal databases and signal classification database using CSV file formats Ability to export I/Q data into CSV, MATLAB®, and IQT format for additional post-analysis Backlit display, viewable in direct sunlight, and extended battery performance with hot-swappable dual batteries Rugged design per MIL-PRF-28800F Applications Spectrum management Spectrum monitoring and surveillance Interference detection and troubleshooting Signal hunting Signal identification Signal intelligence (SIGINT) Homeland Security Interference troubleshooting has never been so easy Evolving digital RF communication standards pose an unprecedented challenge to the surveillance and security community. Identification of unknown signals and determining their precise location has traditionally been accomplished using a combination of lab-grade spectrum analyzers, handheld spectrum analyzers, oscilloscopes, and offline analysis capabilities using PCs. When lab equipment is used in the field, several limitations appear. Such instruments are not meant for field use, can be easily damaged, are not portable, and require AC power. Signal classification using these systems often requires a lot of prior knowledge about these signals, particularly when they are digital. With such systems the unknown signals can be difficult or impossible to identify. With field-ready, rugged hardware featuring DPX Live technology, outstanding displayed average noise level (DANL), spurious free dynamic range (SFDR), phase noise, and easy LAN networking capability in a handheld unit, the H500 and SA2500 are a great choice for generalpurpose spectrum measurements and ideal signal-hunting tools.
Open the catalog to page 1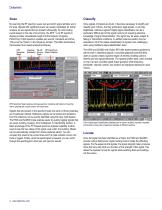
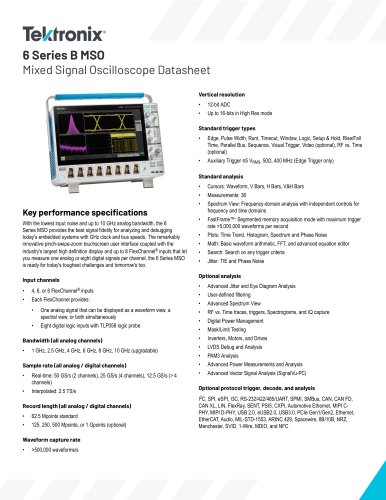
By scanning the RF spectrum users can spot which signal emitters are in the area. Signals with significant power are usually candidates for further analysis, as are signals that are present infrequently. By color-coding events based on the rate of occurrence, the DPX™ Live RF spectrum display provides unparalleled insight into the behavior of signals. Performing 10,000 spectrum updates per second, transients as brief as 125 us can be "frozen" in the frequency domain. This offers tremendous improvement over swept analysis techniques. Hopping VM.AN DPX Spectrum Bluetooth Access Mask Violation Freq/Span...
Open the catalog to page 2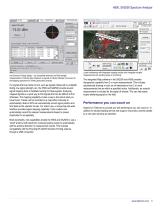
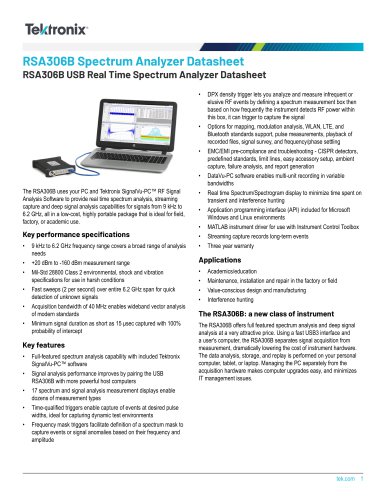
Ref Level ||-60 dBm AutoLevel | 4 | Span: 1.200000 MHz 7 Freq 11 2000.000000 MHz Signal Strength: File View Setup lock- Signal Strengtfi | Settings Map It Summary j Freq (MHz) Amplitude Azimuth GPF. * Restore Settings User Name Use Direction Finding display - use compatible antennas and field strength measurements to find the likely directions to signals of interest. Results can be sent to the Mapping application for further geolocation analysis. For signals that are harder to find, such as signals influenced by multipath, fading, low signal strength, etc, the H500 and SA2500 provide several...
Open the catalog to page 3
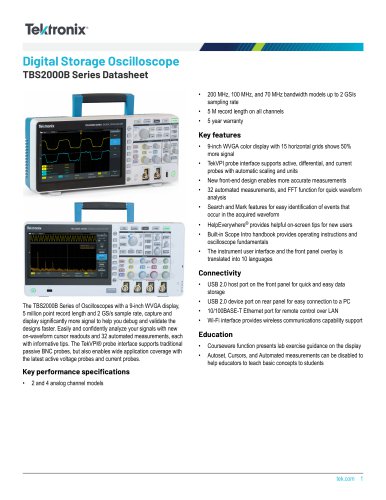
Specifications All specifications apply to all models unless noted otherwise. Model overview Model Real-time bandwidth Frequency range Minimum event duration for 100% POI SFDR (typical) General performance characteristics RF input Operating frequency range Maximum operating input level +20 dBm peak envelope power This is the maximum input level at which the instrument will meet its performance specifications. For a signal without any amplitude variation, peak envelope power = rms. Maximum Input Power without 50 Wrms below 3.2 GHz Damage 15 Wrms between 3.2 GHz and 6.2 GHz IF output Output impedence...
Open the catalog to page 4
H500, SA2500 Spectrum Analyzer General performance characteristics External reference input impedance Frequencey range Input level range -15 dBm to +15 dBm, 1 MHz to 15 MHz -10 dBm to +15 dBm, 16 MHz to 20 MHz dBm levels assume 50 ohm source Integrated GPS receiver Position Accuracy (typical) Position Update Rate (nominal) Spectrum analyzer characteristics Frequency Span Center frequency setting resolution Swept spans (wide scanning) Span Range Scan Speed Resolution Bandwidth (RBW) RBW Range Spectral purity Displayed average noise level, -153 dBm, 10 MHz to 2 GHz, 10 Hz RBW preamp On -152 dBm,...
Open the catalog to page 5All Tektronix catalogs and technical brochures
 5 Series B MSO
67 Pages
 5 Series MSO Low Profile
40 Pages
 4 Series B MSO
55 Pages
 3 Series MDO
35 Pages
 6 Series B MSO
76 Pages
 RSA306B
29 Pages
 TBS2000B Series
18 Pages
 TBS1000C Series
15 Pages
 5 Series
40 Pages
 6 Series
41 Pages
 FCA3000 and FCA3100 Series
8 Pages


Archived catalogs
 6 series mso
71 Pages
 5 Series MSO Low Profile
39 Pages
 MPEG Test Systems MTS4000
12 Pages
 5 Series MSO
73 Pages
 5 Series MSO 2022
67 Pages


- Power supply unit
- DC power supply
- Management software solution
- Automation software solution
- Analysis software solution
- Windows software
- Automatic analyser
- Real-time software
- Cloud-based software
- Control software
- Benchtop analyser
- Single-output power supply
- Switching power supply
- Power supply for industrial applications
- Industrial software
- Portable analyzer
- Interface software
- Measurement software
- Generator
- Power supply with overload protection