
- Catalogs
- Techno Optis Co., Ltd.
- Example of optical measurement

Example of optical measurement

Example of optical measurement
Micro-LEDs are emerging as a next-generation display technology, surpassing traditional LCDs and OLEDs. They are particularly suitable for applications like AR/VR, automotive displays, and smartwatches. The miniaturization of LED chips to less than 100 microns presents unique challenges and opportunities in optical measurement and evaluation.
Traditional LED measurements involve luminous flux, chromaticity, and peak wavelength. However, micro-LEDs require more precise methods due to their small size. PL (Photoluminescence) and EL (Electroluminescence) inspections at the wafer level can improve yield and reduce costs. These inspections help evaluate optical characteristics such as individual LED die variation and in-plane uniformity.
Micro-LED cells are evaluated similarly to LCDs and OLEDs, but their smaller size necessitates advanced techniques. Using a 2D spectroradiometer with a zoom lens allows for comprehensive evaluation of emission status and sub-pixel performance. This includes assessing brightness variation and viewing angle characteristics.
The color conversion method uses QD and phosphor materials to display RGB colors. However, blue light leakage can occur, affecting color gamut. A 2D spectroradiometer combined with a microscope can verify leakage light and evaluate mixed colors within subpixels.
Uneven deposition during production can cause roughness in micro-LED dies, affecting peak wavelength and luminance. A 2D spectroradiometer and microscope enhance visibility of brightness uniformity, allowing for detailed comparison of luminance and chromaticity.
New standards like BT-2020 for ultra-high definition television require high chromaticity accuracy. Key parameters include dominant wavelength, excitation purity, and peak wavelength. Optical measurement units such as luminous flux, intensity, and radiance are crucial for accurate evaluation.
The document includes definitions of key terms such as chromaticity, dominant wavelength, and various optical measurement units, providing a comprehensive understanding of the technical aspects involved in micro-LED evaluation.
Catalog excerpts

Example of optical measurement evaluation of Micro-LED Evaluation and analysis example © Individual variation evaluation of subpixels in cell planes © Unevenness evaluation in cell planes © Measurement of leakage light by mixing color of color conversion method © Roughness evaluation in subpixel plane Appendix / Glossary
Open the catalog to page 1
Introduction As a next generation display following LCDs (LCDs) and OLEDs (OLEDs), the development of micro-LEDs, quantum dot (QD) displays, etc. is becoming popular. By miniating the chip size to less than 100 microns and nm levels compared to existing LEDs, many research institutes and companies are actively developing displays that have the performance of surpassing conventional LCDs and OLED displays. These devices are also ideal for new applications such as AR (augmented reality) / VR (virtual reality) / MR (mixed reality) / SR (alternative reality), automotive head-up displays (HUDs), micro...
Open the catalog to page 2
Dominant Wavelength Peak Wavelength In general, when evaluating the die of micro LEDs, there is an evaluation method for measuring the spectral spectrum and peak wavelength by installing an integrating sphere on the light emitting surface and measuring it using a spectrometer via optical fiber (Fig.4). However, because the die size is smaller, it is difficult to align, and it takes a very long time to evaluate because it is necessary to measure individually according to the emission point of each point. For example, if more than 10,000 die on a 6-inch wafer is inspected, the 2D spectroradiometer...
Open the catalog to page 3
© Measurement of leakage light by mixing color of color conversion method Luminance Chromaticity Spectram 191 The color conversion method is a technology that displays RGB by changing the color that emits light by using QD and phosphor for micro-sized blue LEDs and UV-LEDs. When QD is used for the blue LED, blue light leaks through the gap between the particles of qD (Fig.14), so the output of blue light may be generated when G or R is emitted (Fig.15). This can cause color mixing and have a significant effect on the gamut (Fig.16). A 2D spectroradiometer SR-5100 series and microscopes are combined...
Open the catalog to page 4
•Optical measurement unit The radiant flux that outputs light per unit time in all directions as the radiation amount that light spreads as an electromagnetic wave, the radiant intensity that outputs light emitted per unit stereoscopic angle in a particular direction, and the radiant intensity that outputs per unit area are expressed as radiance. Radiance can be calculated from the accrual of the emission spectrum (spectral radiance). For physical radiation, the human eye is sensitive to brightness, and the amount of photometric value that takes into account its wavelength characteristics is...
Open the catalog to page 5
TechnoOptishttps://www.techno-optis.com/enTechnoOptis Co., Ltd. formerly Topcon Technohouse Corporation 4F, Imas Itabashi BASE, 2-4-1, Sakashita, Itabashi-ku, Tokyo 174-8580 JAPAN E-mail : [email protected] URL : https://www.techno-optis/en techno optis Printed in Japan 2026 05 E6
Open the catalog to page 6All Techno Optis Co., Ltd. catalogs and technical brochures
 Optical measurement
6 Pages
 Next generation
6 Pages
 Automotive
8 Pages
 AR/VR
AR/VR8 Pages
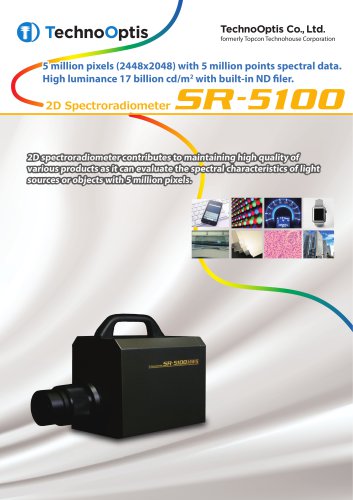 SR-5100
8 Pages
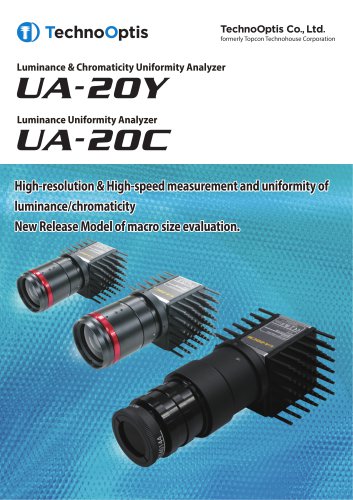 UA-20
UA-206 Pages
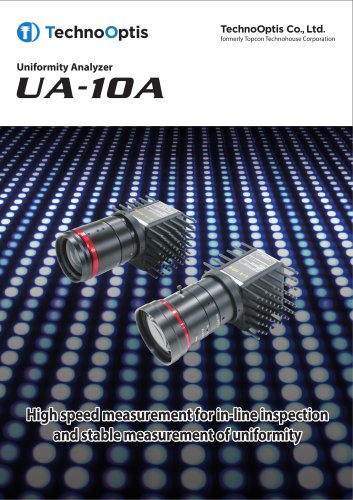 UA-10A
4 Pages
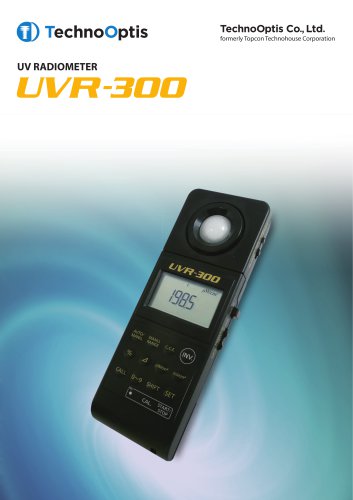 UV Radiometer UVR-300
4 Pages
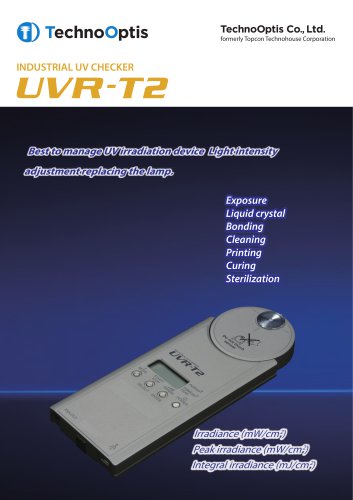 Industrial UV Checker UVR-T2
4 Pages
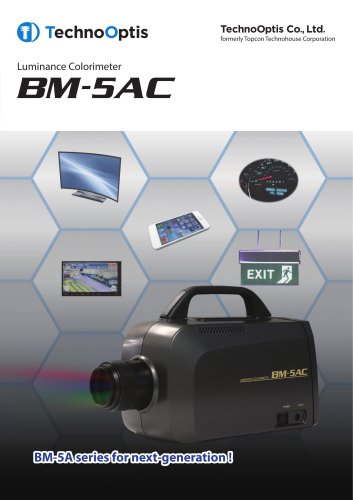 Luminance Colorimeter BM-5AC
4 Pages
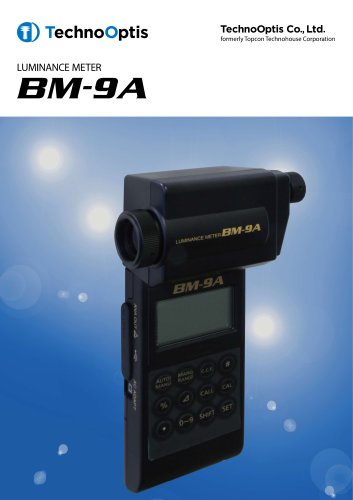 BM-9A
BM-9A4 Pages
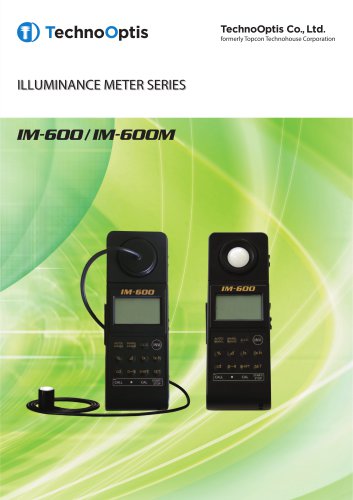 IM-600
4 Pages
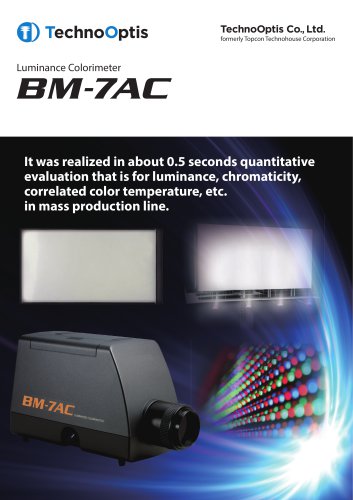 Luminance Colorimeter BM-7AC
4 Pages
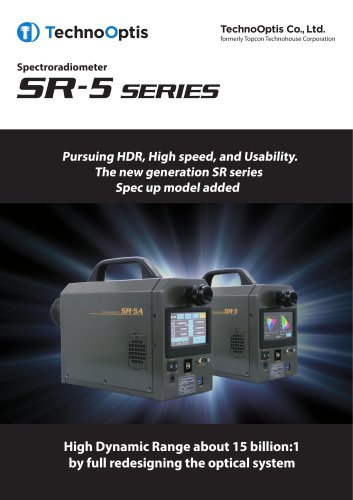
Archived catalogs
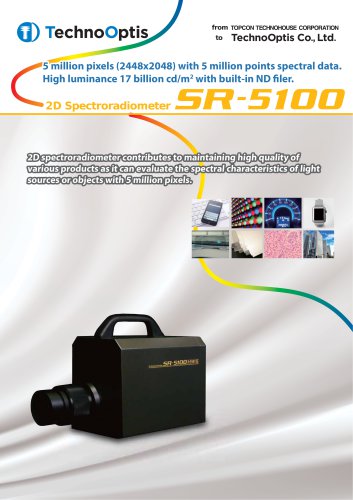 Spectroradiometer SR-5100
8 Pages
- Automation software solution
- Management software solution
- Process software
- Windows software
- Control software
- Measurement software
- Compact analyzer
- Quality control analyzer
- Inspection software
- Calibration software
- Printing software
- Colorimeter
- Photometer
- Imaging software
- Electric software
- Color software
- Inspection analyzer
- Color analysis colorimeter
- Measurement spectroradiometer