Catalog excerpts

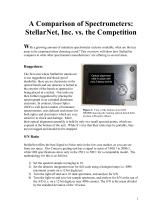
A Comparison of Spectrometers: StellarNet, Inc. vs. the Competition With a growing amount of miniature spectrometer systems available, what are the key areas to be examined when choosing a unit? This overview will show how StellarNet compares to what other spectrometer manufacturers’ are offering in several areas. Ruggedness The first area where StellarNet stands out is our ruggedness and shock-proof durability: there are no electronics in the optical bench and our detector is bolted to the exterior of the bench as apposed to being placed in a socket. Our units are then further ruggedized by placing the spectrograph in an extruded aluminum enclosure. In contrast, Ocean Optics (OOI) a well known maker of miniature Figure 1: View of the bottom of an OOI spectrometers, uses delicate enclosures for HR4000 showing the rotating optical bench held both optics and electronics which are very in place with epoxy (blue). sensitive to shock and damage. More, their optical alignment assembly is held by only two small epoxied points, which are exposed at the bottom of the unit. While it’s true that their units may be portable, they are not rugged and should not be dropped. S/N Ratio StellarNet offers the best Signal to Noise ratio in the low-cost market, as you can see from our specs. Our Concave grating unit has a signal to noise of 1000:1 to 2000:1, while OOI specifications show only in the 250:1 to 500:1 for a comparable model. The methodology for this is as follows: 1) Set the spectral sample averaging to 10. 2) Set the detector integration time for full scale using a halogen lamp (i.e. 4096 maximum counts on a 12-bit digitizer). 3) Turn the light off and save 10 dark spectrums, and analyze for S/N. 4) Turn the light on and save ten sample spectrums, and analyze for S/N at the top of the A/D (i.e. on a 12-bit digitizer near 4096 counts). The S/N is the mean divided by the standard deviation of the 10 scans.
Open the catalog to page 1
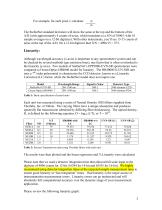
For example, for each pixel i; calculate: The StellarNet standard deviation will show the same at the top and the bottom of the A/D (with approximately 4 counts of noise, which translates to a S/N of 1000/1 with 10 sample averages on a 12-bit digitizer). With other instruments, you’ll see 13-15 counts of noise at the top of the A/D. On a 12-bit digitizer then S/N = 4096/15 = 273. Linearity: Although wavelength accuracy (x-axis) is important to any spectrometer system and can be checked by several methods (gas emission lines), one factor that is often overlooked is the linearity (y-axis)....
Open the catalog to page 2
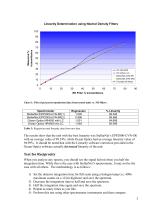
Linearity Determination using Neutral Density Filters 100 90 80 Measured % transmittance OO HR-4000 OO without LC StellarNet-UVN-SR StellarNet-UVN-SR2 Thorlabs ND filters Chart 1: Plot of percent transmission data from tested units vs. ND filters Spectrometer StellarNet EPP2000-UVN-SR(1) StellarNet EPP2000-UVN-SR(2) Ocean Optics HR4000 with LC Ocean Optics HR4000 w/o LC Table 3: Regression and linearity data from raw data The results show that the unit with the best linearity was StellarNet’s EPP2000-UVN-SR with an average value of 99.54%, while Ocean Optics had an average linearity value...
Open the catalog to page 3
Can You Take the Heat Wavelength stability as a function of temperature is important for all spectrometers, especially for field measurements. To test this use a Mercury-Argon gas emission tube (such as the StellarNet SL2 lamp) and heat or cool the spectrometer (from 10°C - 20°C) while watching any selected gas peak wavelength. The wavelength should not shift as a function of temperature. All StellarNet spectrometers utilize optimal thermal design and stabilization circuitry to minimize baseline and wavelength drift. On the other-hand it has been documented by the USDA UV-B Monitoring and...
Open the catalog to page 4
Don’t Be Fooled by Numbers OOI has switched to the Toshiba TCD1304AP detector in most of their spectrometer models. They claim that this is a superior 3648 element CCD detector, when actuality it is a PDA detector with a CCD readout. While this means that it should have better Signal to Noise ratio than a CCD, it will not be as sensitive. This detector also has lots of noise which precludes it from many “real” spectroscopy apps other than teaching labs. Figure 3: Schematic of the Toshiba 3648 detector showing PDA detector/CCD readout. Speed How fast do you need your data? All of...
Open the catalog to page 5
StellarNet’s EPP2000C has the lowest stray light values of any portable spectrometer unit, thanks to the specially design concave grating optical bench (see details above in “Quality Price Performance”); 0.02% at 435nm and 0.05% at 200nm. Where does it come from? StellarNet manufactures virtually everything in house, from light sources, spectrometer circuitry, even, fiber optic cables. Other manufacturers are known for buying and reselling parts, and only putting their label on it. What this means is a more knowledgeable staff who can better answer your questions, from every step of the...
Open the catalog to page 6All StellarNet catalogs and technical brochures
-
StellarCASE-LIBS
1 Pages
-
StellarCASE-Raman
1 Pages
-
StellarCASE-NIR
1 Pages
-
RED-Wave-Micro Spectrometer
1 Pages
-
StellarHaze
1 Pages
-
StellarNet product catalog
60 Pages
-
Low Cost Integrating Spheres
1 Pages
-
Color Measurement Systems
2 Pages
-
SpectroFluorometer
1 Pages
-
SpectroChemistry
2 Pages
-
SpectroColorimeter
2 Pages
-
EPP2000-UVN-SR
2 Pages
-
EPP2000-HR
1 Pages
-
SSR- Laser Subsystems
2 Pages
-
RED-Wave NIR InGaAs
2 Pages
-
MODEL RRDP DIP PROBE
2 Pages
-
Fiber Optic Probe
2 Pages
Archived catalogs
-
Microscopy Systems
2 Pages


