SWK
1 /156Pages

SWK
1 /156Pages
Catalog excerpts

WHAT MAKES US DIFFERENT 2015 A N N UA L R E P O R T
Open the catalog to page 1
LETTER TO SHAREHOLDERS In 2015, we made substantial progress against our long-term strategic and financial objectives, generating increasing value for shareholders, while continuing to position Stanley Black & Decker for a future of sustained high performance. The results achieved are a testament to the entire Stanley Black & Decker team’s agility and passion to perform, as well as the enduring strength of our world-class franchises. Highlights from the year included: • utperforming our peer group and the overall S&P 500, with SWK’s O share price up 11% for the year versus 5% for our peers and...
Open the catalog to page 3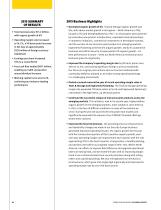
2015 SUMMARY OF RESULTS • otal revenues were $11.2 billion, T with organic growth of 6% • perating margin rate increased O to 14.2%, a 90 basis point increase in the face of approximately $220 million of foreign currency headwinds • arnings per share increased E 10% to a record $5.92 • ree cash flow totaled $871 million, F enabling our 48th consecutive annual dividend increase • orking capital turns were 9.2X, W continuing our industry-leading performance 2015 Business Highlights • enerated organic growth of 6%. Tools & Storage organic growth was G 8%, with above-market growth in all regions — North...
Open the catalog to page 4
The Evolution Of Stanley Black & Decker Stanley Black & Decker has undergone a notable transformation over the last 15 years — evolving from a small cap building products company to a large cap diversified industrial. This transformation encompassed three distinct phases: • period of restructuring in the late 1990s through the early 2000s when A we were primarily a tools and doors company, generated low growth and a low-teens operating margin rate, and when we began our move towards acquisitions to position the Company for growth • he Security platform build between 2005 and 2010, a period when...
Open the catalog to page 5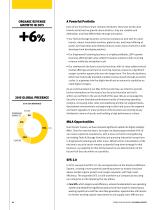
ORGANIC REVENUE GROWTH IN 2015 A Powerful Portfolio Each of our franchises share common attributes: they have world-class brands and attractive growth characteristics, they are scalable and defensible, and they differentiate through innovation. • ur Tools & Storage business is the tool company to own with its iconic O brands, robust innovation machine, global scale, and broad offering of power and hand tools and related products across many channels in both developed and developing markets • ur Engineered Fastening business is a highly profitable, GDP+ growth O business offering high value-added...
Open the catalog to page 6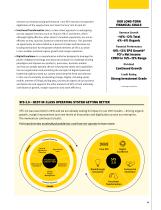
OUR LONG-TERM FINANCIAL GOALS enhance our already strong performance. Core SFS now also incorporates digitization of the supply chain and ‘smart factory’ into its tool kit • unctional Transformation takes a clean-sheet approach to redesigning F our key support functions such as Finance, HR, IT and others, which although highly effective, after almost a hundred acquisitions are not as efficient as they could be, based on external benchmarks. This presents an opportunity to reduce SG&A as a percent of sales and becomes our funding mechanism for the growth-related elements of SFS 2.0, which in turn...
Open the catalog to page 7
JOHN F. LUNDGREN Chairman & Chief Executive Officer • Commercial Excellence is about how we become more effective and efficient in our customer-facing processes resulting in continued share gains and margin expansion throughout our businesses. We view Commercial Excellence as world-class execution across seven areas: customer insights, core innovation and product management, pricing and promotion, brand and marketing, sales force deployment and effectiveness, channel programs, and the customer experience. We have applied these principles in several businesses and identified a significant correlation...
Open the catalog to page 8
FINANCIAL HIGHLIGHTS** (MILLIONS OF DOLLARS, EXCEPT PER-SHARE AMOUNTS) SWK Revenue $ 11,171.8 $ 11,338.6 $ 10,889.5 $ 10,022.4 $ 9,332.3 Gross Margin — $ $ 4,072.0 $ 4,102.7 $ 3,933.2 $ 3,686.9 $ 3,461.3 Gross Margin — % 36.4% 36.2% 36.1% 36.8% 37.1% Working Capital Turns 9.2 9.2 8.1 7.8 7.3 Free Cash Flow* $ 871 $ 1,005 $ 528 $ 593 $ 706 Diluted EPS from Continuing Operations $ 5.92 $ 5.37 $ 4.98 $ 4.72 $ 4.65 Tools & Storage Revenue $ 7,140.7 $ 7,033.0 $ 6,705.0 $ 6,413.0 $ 6,213.3 Segment Profit — $ $ 1,170.1 $ 1,074.4 $ 969.6 $ 951.3 $ 850.1 Segment Profit — % 16.4% 15.3% 14.5% 14.8% 13.7%...
Open the catalog to page 9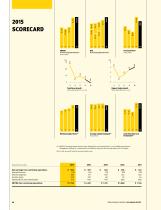
EBITDA (Continuing Operations)(a) Free Cash Flow(c) ($ MILLIONS) Total Sales Growth Working Capital Turns Organic Sales Growth Average Capital Employed ($ BILLIONS) Cash Flow Return on Investment(f) (a) “ BITDA” (earnings before interest, taxes, depreciation, and amortization) is a non-GAAP measurement. E Management believes it is important for the ability to determine the earnings power of the Company. (b), (c), (d), (e) and (f) refer to the inside back cover. Net earnings from continuing operations $ Interest income Interest expense Income taxes Depreciation and amortization EBITDA from continuing...
Open the catalog to page 10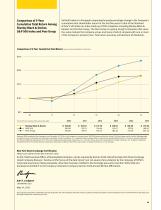
Comparison of 5-Year Cumulative Total Return Among Stanley Black & Decker, S&P 500 Index and Peer Group Set forth below is a line graph comparing the yearly percentage change in the Company’s cumulative total shareholder return for the last five years to that of the Standard & Poor’s 500 Index (an index made up of 500 companies including Stanley Black & Decker) and the Peer Group. The Peer Group is a group of eight companies that serve the same markets the Company serves and many of which compete with one or more of the Company’s product lines. Total return assumes reinvestment of dividends....
Open the catalog to page 11
• STANLEY Engineered Fastening A GLOBAL INDUSTRIAL LEADER • Commercial Electronic Security • Power Tools & Accessories • Hand Tools & Storage • Mechanical Access IN COMMERCIAL ELECTRONIC SECURITY THOUSAND PRODUCTS MOST PATENTS AWARDED OF THE 100 MOST SUSTAINABLE COMPANIES IN THE U.S. TOOLS & STORAGE The worldwide leader in tools and storage, we create the tools that build and maintain the world. Tradespeople and Do-It-Yourselfers alike rely on us every day for the toughest, strongest, most innovative hand tools, power tools and storage solutions in the market. We deliver peace of mind with advanced...
Open the catalog to page 12All Stanley Tools catalogs and technical brochures
 Investor Overview
13 Pages
 Investor Materials
62 Pages
 Storage
20 Pages
 Hammers
12 Pages
 Saws
Saws16 Pages
 Measuring Tools
10 Pages
 2011 Hand Tools Catalog
212 Pages
