Isight 5.8
1 /3Pages

Isight 5.8
1 /3Pages
Catalog excerpts
Isight 5.8 An open desktop solution for creating flexible simulation process flows, consisting of a variety of applications, to automate the exploration of design alternatives, identify optimal performance parameters and integrate added-value systems. Interfaces Isight has been designed with ease-of-use in mind. Highly visual and intuitive interfaces, wizards, and drag-and-drop capabilities allow you to work quickly and efficiently. Design Gateway Leverage this intuitive graphical user interface to quickly create integrated simulation process flows that couple simulation programs regardless of discipline, programming language, or format. It provides drag-and-drop process flow creation, parameter mapping, and problem formulation. This feature-rich process editor supports powerful file parameters that can represent simulation models as variables as well as dynamically sizable arrays for both inputs and outputs. It also provides branching, looping, conditional statements of arbitrary complexity with any parameter, and other execution logic. At any point in the automated process flow, a break can be inserted to allow user intervention. This flexibility, combined with Jython/Python scripts to alter the runtime behavior of the model as a function of changing parameter values, allows the creation of highly reusable processes. If an authoring error is made, the user can easily restore to a previously auto-saved version. Once the process flow is defined, the user interface enables easy import of externally defined parameter values and problem formulations. Utilities such as model search, model content overview, parameter search, and parameter grouping are also supported. Runtime Gateway Execute engineering process flows and create graphs and tables to visualize results. The user can choose between two execution engines: a desktop execution engine, or a distributed execution engine based on embedded SEE technology. All job results are saved automatically to a locally managed database. The pack-and-go utility makes it easy for users to share models and results. The user interface supports the creation of visual tools for real-time postprocessing of data such as tables, 2D and 3D plots, correlation maps and tables, self organizing maps, and statistical analysis. Run data can be filtered and graded with a flexible set of criteria. All scatter plots allow easy one-click visualization of the virtual prototype by dedicated simulation results viewers. It provides interactive tools
Open the catalog to page 1
Isight 5.8 for visualizing parameter relationships and performance attribute trade-offs with interactive approximations. Users can share these approximations with non-Isight users by exporting them to Excel. Component Development Environment An easy-to-use component development environment based on EclipseTM supports the creation of application components that communicate with one another in the Isight environment. Add custom techniques, including DOE, approximation, approximation error analysis, optimization and Monte Carlo sampling methods, and random variable distributions. Leverage the APIs...
Open the catalog to page 2
Monte Carlo Analysis Define your optimization problem in terms of variables and multiple weighted and scaled objectives and constraints using the following algorithms: Gradient: NLPQL, MMFD, LSGRG2; Pattern: Hooke-Jeeves, Downhill Simplex, Adaptive Simulated Annealing; Mixed Integer/Real: MISQP, MOST; Genetic Algorithms: Evolution, Multi-Island GA; Multi-Objective: AMGA, NSGA II, NCGA, Particle Swarm; Other: Stress-Ratio Method, Pointer I & II Automatic Optimizer, Multi-objective Approximation Loop. Specify target values for the output parameters of the process flow and deploy the target solver...
Open the catalog to page 3Archived catalogs
 SIMULIA
6 Pages
 CATIA ELECTRICAL SOLUTIONS
8 Pages
 SIMULIA ExSight
2 Pages
 Abaqus for CATIA V5
6 Pages
 SIMULIA V6R2013
6 Pages
 SIMULIA DesignSight Thermal
2 Pages
 CATIA Structural Analysis
2 Pages
 CATIA Surface FE Modeling
2 Pages
 CATIA Advanced FE Modeling
2 Pages
 SIMULIA Execution Engine
2 Pages
 CATIA ICEM SHAPE DESIGN
5 Pages
 CATIA ICEM AEROEXPERT
5 Pages
 CATIA for Creative Designers
9 Pages
 power of CATIA
1 Page
 EN O V IA V 6R 2013x
12 Pages
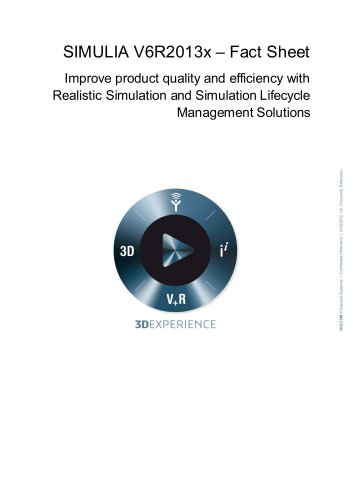 SIMULIA V6R2013x_2012
7 Pages
 SIMULIA V5-6R2016
6 Pages
 ABAQUS UNIFIED FEA
6 Pages
 fe-safe
6 Pages
 Isight
6 Pages
 SIMULIA
28 Pages
 CST STUDIO SUITE® 2017
32 Pages
 XFlow
XFlow6 Pages
 XFlow 2019x
2 Pages
 Opera
Opera12 Pages
 ABAQUS/CAE 2017
4 Pages
 ABAQUS/STANDARD 2017
3 Pages
 SIMULIA V6R2013x_2015
4 Pages
 Abaqus 6.8
8 Pages


- Management software solution
- Automation software solution
- SIMULIA analysis software
- SIMULIA process software
- Real-time software
- SIMULIA CAD software
- Cloud-based software
- Control software
- SIMULIA design software
- SIMULIA 3D software
- SIMULIA industrial software
- SIMULIA interface software
- Measurement software
- SIMULIA quality software
- Visualization software solution
- SIMULIA simulation software
- Automated software
- SIMULIA development software
- Network software
- SIMULIA engineering software