- Catalogs
- Shimadzu France
- Data Analysis Software for Comprehensive GC ChromSquare
- Products
- Catalogs
- News & Trends
- Exhibitions
Data Analysis Software for Comprehensive GC ChromSquare
1 /2Pages

Data Analysis Software for Comprehensive GC ChromSquare
1 /2Pages
Catalog excerpts

Data Analysis Software for Comprehensive GC ChromSquare C18 Fatty Acid Components Volatile Components in Coffee Beans (provided by Prof. Mondello at the University of Messina) Enables analysis of large amounts of information in an easier, more reliable manner Interaction Functions Allow Confirming Spot Information at a Single Glance A 2D map, chromatogram view, mass spectrum, and spot information can be displayed in the same window. Modulation time and spectra are used to decide whether a peak belongs to a certain spot. Displays peaks in the corresponding one-dimensional chromatogram using the same color as the spot boundary in the 2D map. Moving the cursor across the 2D map displays the corresponding location on the one-dimensional chromatogram and displays the mass spectrum corresponding to that position. Mass Spectrum of Cursor Position Shows the relationship between the 2D map and spot table highlighted. Closely Linked to GCMSsolution Cursor position Chromatogram view In addition to being able to directly import data from GCMSsolution, ChromSquare can also use GCMSsolution mass spectra search technology. Directly import data from GCMSsolution. Search spectra using the GCMSsolution library search engine. In upto 5 libraries can be searched simultaneously including linear retention indices. In addition to the general-purpose NIST libraries available for GCMSsolution, an extensive selection of mass spectral libraries from Shimadzu can be used, such as the FFNSC Library for flavor and fragrance and a Pesticide Library. Spot Information Table This table summarizes the retention time, intensity, and compound name information for spots.
Open the catalog to page 1
Perform quantitative analysis tasks by simply switching between three panels. • Simply switch between the three panels displayed in the same window (Schedule, Chromatogram, and Method) to perform qualitative analysis, prepare calibration curves, or even perform quantitative analysis. • Identify spots from multiple sets of data for quantitative analysis using retention times or mass spectra similarity filtering. ■ Flowchart of Calibration Curve Preparation and Quantitation Process Schedule Table Preparation Specify data file and calibration level. Send information on spot to be quantitated and calibration...
Open the catalog to page 2All Shimadzu France catalogs and technical brochures
 LCMS-2050
16 Pages
 MCT Series
12 Pages
 TX/TXB/TW Series
8 Pages
 LCMS-TQ RX Series
16 Pages
 UV-2600i Plus /UV-2700i Plus
20 Pages
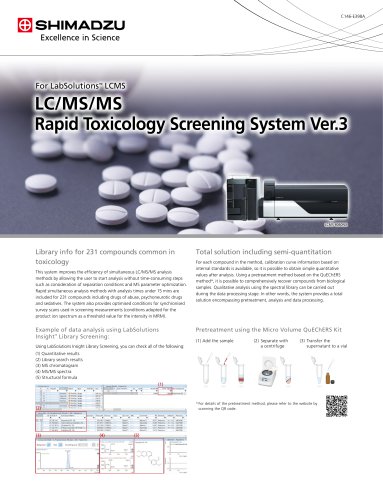 LC/MS/MS
2 Pages
 AUTOGRAPH AGX-V2 Series
28 Pages
 Metabolomics Product Portfolio
24 Pages
 Nexera UC/Nexera UC Prep
20 Pages
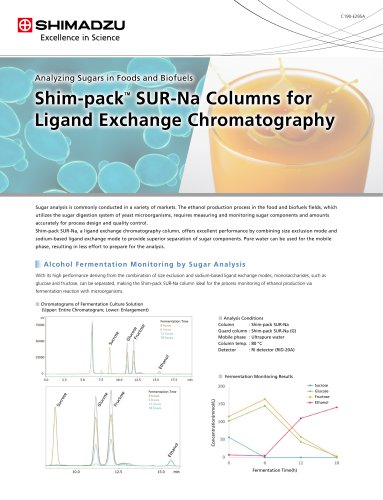 Shim-pack ™ SUR-Na Columns
2 Pages
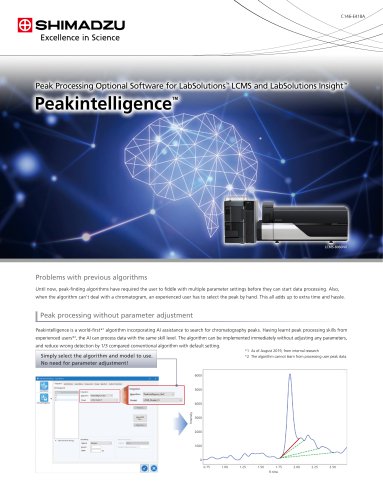 Peakintelligence
2 Pages
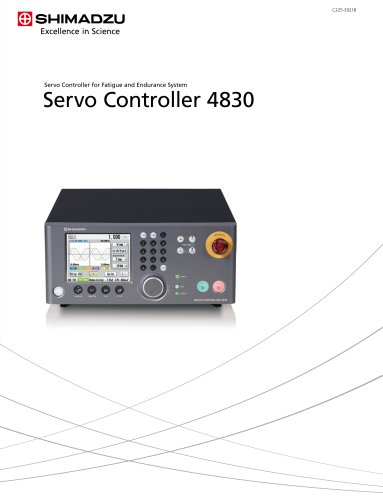 Servo Controller 4830
12 Pages
 LabSolutions Sync
2 Pages
 LabSolutions Detect
8 Pages
 SALD-7500nano
16 Pages
 Multimodal Imaging System
4 Pages
 LCMS Family Brochure
12 Pages
 FluxEdge GC Systems
8 Pages
 Xslicer SMX-1010/1020
16 Pages
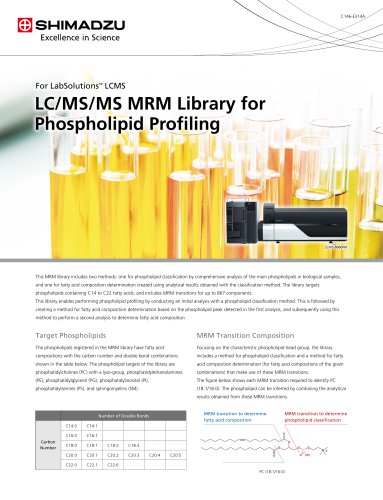 LC/MS/MS MRM
2 Pages
 LC/MS/MS
2 Pages
 TRViewX
8 Pages
 UW/UX Series
4 Pages
 LCMS-8060
20 Pages
 QC Reporter
6 Pages
 OneSight
4 Pages
 TD-30 Series
12 Pages
 Nexis GC-2030
20 Pages
 ATX/ATY series
4 Pages
 MOC63u
6 Pages
 UHPLC Nexera X2
20 Pages
 TOC-L
TOC-L16 Pages
 RF-6000
24 Pages
 iMScope Trio
28 Pages
 ICPE-9800 series
20 Pages
 UV-3600 Plus
26 Pages
 EDX-7000/8000
24 Pages
 Capillary GC-2010 Plus
24 Pages
 GCMS QP2010 Ultra
24 Pages
 LCMS-IT-TOF
16 Pages
 Headspace Sampler HS-20
8 Pages
 BW-K/BX-K Series
2 Pages
 Catalog MOC 120H
4 Pages
 ELB SERIES
2 Pages
 TW TWC SERIES
8 Pages
 AUW-D/AUW/AUX/AUY Series
8 Pages
 Catalog UW-Series
6 Pages
 Catalog AU-Series
8 Pages
 MDGC-2010 system
1 Page


Archived catalogs
 TOC-4110
1 Page
 Catalogue HMV-2 Series
8 Pages
 Shimadzu FTIR Overview
4 Pages
 Shimadzu Software Overview
8 Pages
 Shimadzu GC/GCMS Overview
6 Pages
 Shimadzu LC/LCMS Overview
12 Pages
 Shimadzu X-ray Fluorescence
2 Pages


- Shimadzu testing machine
- Digital imager
- Visible imager
- Test cabinet
- CMOS camera module
- Management software solution
- Industrial camera module
- Concentration analyzer
- Monitoring analyzer
- Infrared imager
- Automatic analyser
- Temperature test chamber
- Real-time software
- Microscope
- Shimadzu material testing machine
- Shimadzu automatic testing machine
- Indentation hardness tester
- Shimadzu digital scale
- Solids analyser