Group: Sensofar

Catalog excerpts

Advanced Analysis Software
Open the catalog to page 1
SensoMAP Advanced Analysis Software SensoMAP, based on Mountains technology from Digital Surf, is an extremely powerful tool for analysis and reporting. SensoMAP software is modularly adaptable to customer requirements. Two levels (standard and premium) and several modules are available.
Open the catalog to page 2
Extremely powerful report creation Designed for use with the broadest range of research and industrial applications, SensoMAP software is the perfect surface imaging, analysis and metrology solution that is fully integrated with Sensofar 3D optical profilers. It includes: IMAGING Visualization of surface data using cutting-edge imaging technology and intelligent filters. METROLOGY Analytical studies in accordance with the very latest standards and methods. REPORTING Creation of detailed, accurate multi-page surface analysis reports in a smart desktop publishing environment with powerful...
Open the catalog to page 3
IMAGING View your surface data in high quality 3D Real-time 3D imaging In SensoMAP, you can zoom in on a 3D surface and rotate it in real time. To achieve the best image quality, you can apply image enhancement tools, choose the best lighting conditions, select renderings, set surface height amplification, and use an optimized color palette for the vertical scale. In addition, you can display contour diagrams and photo simulations and you can extract 2D profiles from a 3D surface for visualization and analysis.
Open the catalog to page 4
Overlay color and intensity images on 3D surface topography Multi-channel topography, color and intensity image layers can be manipulated simultaneously. With a single click, you can overlay the color or intensity image on the 3D surface topography to speed up the detection of surface features. You can adjust the transparency of the overlay to achieve optimal rendering. Color image 0% transparency Image overlay on topography 60% transparency Image overlay on topography 30% transparency Pseudo-color 3D surface topography 100% transparency
Open the catalog to page 5
Extract a sub-surface and analyze it just like a full surface Once a sub-surface or region of interest has been extracted it can be analyzed in exactly the same way as a full surface; the parameters are calculated for the subsurface only. For example, you can study the roughness, flatness and coplanarity of planes on MEMS and mechanical and electronic components. There are several methods for extracting sub-surfaces: ■ Extract a rectangular or non-rectangular zone. ■ Remove the upper or lower slice of a surface by thresholding. ■ Apply a binary mask. ■ Automatically partition a surface into...
Open the catalog to page 6
METROLOGY Use powerful tools to prepare surface data for analysis Intelligent operators and filters SensoMAP includes a full set of intelligent operators and filters for normalizing 3D surface data and removing measurement artifacts prior to analysis. They include: ■ Paint cloud manipulation: surface extraction and merging ■ Thresholding ■ Outlier removal ■ Filling in missing data points ■ Spatial filtering and surface smoothing ■ Retouching of isolated artifacts
Open the catalog to page 7
Result calculator ■ Perform calculations using several results/parameters already in your Mountains® document. ■ Go to the Results tab and pick the results you wish to use for the calculation. ■ Rename them and decide how you want to display (in the Results Manager or in the document. Analyze surface geometry SensoMAP assures fast and accurate analysis of surface geometry with tools for measuring distances, angles, areas of peaks and valleys, volumes of bumps and holes, step heights on surfaces and profiles, and coplanarity
Open the catalog to page 8
Standard functional analysis SensoMAP provides standard functional analysis, including the Abbott-Firestone bearing ratio curve and depth distribution histogram, the material/void volume and thickness of up to three vertical surface slices, and surface subtraction for wear analysis. Statistics Powerful statistical tools for handling large quantities of measurement data including multiple data populations. ■ Visualize results instantly with Control chart, Histogram, Scatter plot, Box plot etc. ■ Automatic statistical analysis of multiple data population types (static or dynamic) using...
Open the catalog to page 9
Analyze surface texture according to the very latest ISO and national standards Advanced filtering techniques Separate roughness and waviness components of surfaces using the latest ISO 16610 advanced filtering techniques, including robust Gaussian and spline filters. Previous filtering techniques are also supported. Primary surface Areal parameters Access ISO 25178 height (Sa, Sq, Ssk, Sku, Sz etc.) and bearing ratio (Smr, Sdc, Sxp etc.) parameters. Profile parameters Roughness surface Use ISO 4287 amplitude, spacing, material radio and peak parameters for primary, waviness and roughness...
Open the catalog to page 10
REPORT CREATION Use powerful tools to prepare surface data for analysis Visual analysis reports In SensoMAP you can build a visual analysis report frame by frame, page by page, working in one of six European languages, Brazilian Portuguese, Japanese, Korean or Mandarin Chinese. Frames contain 3D and other views of surface data, the results of applying filters, analytical studies, ISO and national parameters, measurement identity cards, comments and illustrations. You can navigate to any frame in a report by selecting it in the page viewer. Powerful automation features Once an analysis...
Open the catalog to page 11
Different themes available By default, the interface color theme is black. There are other color themes available: gray, white, orange & blue. Pass/fail with tolerance limits Pass/fail criteria with tolerances can be defined for any parameter. Green (pass) and red (fail) traffic lights are displayed automatically and the parameter value and tolerance limits are shown graphically. Data export Frames and pages can be exported as bitmaps up to 1200 dpi for poster sessions. Finished reports can be exported in PDF and RTF formats for easy circulation. All numerical results are accessible in the...
Open the catalog to page 12
OPTIONAL MODULES Different tools and techniques for specific applications SensoMAP is scalable software available on two product levels: SensoMAP Standard SensoMAP Premium SensoMAP Standard provides the features required for standard surface imaging and analysis. It comes with numerous optional modules that can be added at any time for advanced and specialized applications. SensoMAP Premium is a much more powerful solution in terms of features and includes all the modules except: Advance contour, Shell extension, Shell topography, Colocalization, Lead analysis (Twist) and Scale-sensitive...
Open the catalog to page 13All Sensofar Metrology catalogs and technical brochures
-
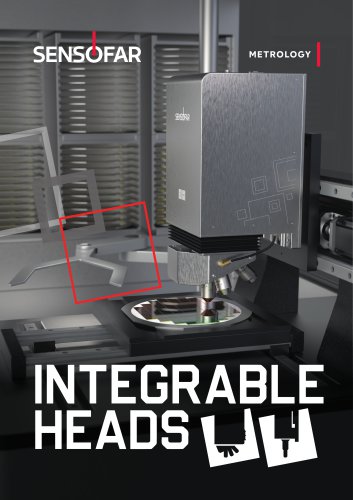 Integrable metrology solutions
36 Pages
-
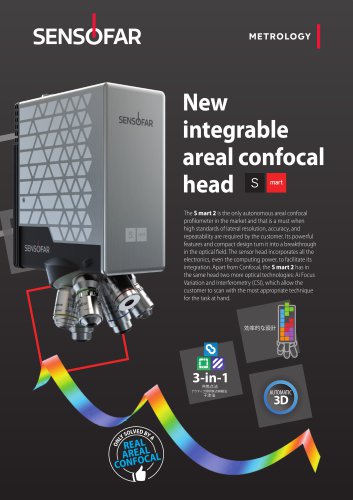 Leaflet S mart 2 sensor
4 Pages
-
 Leaflet S wide sensor
1 Pages
-
 Leaflet S onix sensor
1 Pages
-
 Leaflet S neox sensor
1 Pages
-
 S neox
24 Pages
-
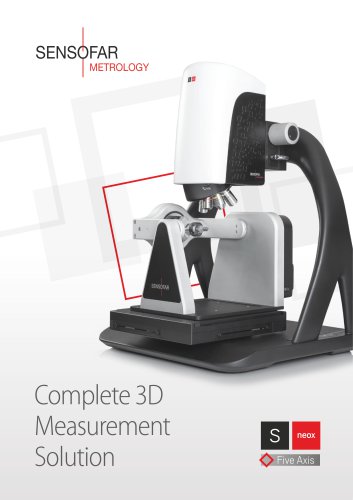 S neox Five Axis
12 Pages
-
 S lynx
12 Pages
-
 S wide
4 Pages