- Catalogs
- Seba Hydrometrie GmbH & Co. KG
- Software Q-View
Software Q-View
1 /2Pages

Software Q-View
1 /2Pages
Catalog excerpts

Q-View Confirm the Integrity of Your ADCP Data Teledyne RDI’s new Q-View software bridges the gap between the requirement for high-quality field measurements and the timeintensive analysis that is typically required to ensure that your collected data meets your quality criteria. This new software application seamlessly integrates with your WinRiver II software, providing you with real-time feedback during data collection, and back in the office when reviewing your data for your unique Quality Assurance program. With its comprehensive, automaticallygenerated professional reports, Q-View provides you with the information you need to efficiently and consistently make the right decisions based on your collected data. Q-View delivers: • Instant data qualification for the field user, saving you valuable time while ensuring that you’ve collected the data set you need Speedy processing, allowing you to create multiple data sets in a fraction of the time Automatic high-quality report generation, giving you the ability to create professional reports in record time Seamless, user-friendly integration with WinRiver II, eliminating the need to learn a new software platform Q-View allows users to: 1. Ensure proper system set up • Check that ADCP tests are run and pass Check for the quality of the compass calibration Evaluate the Moving Bed Test Suggest potential adjustments to the measurement to compensate for magnetic distortions or moving bed phenomenon 2. Access critical QA data during operation The Q-View pop-up information is updated in real-time as the data is collected in WinRiver II and is visible to the Field Hydrologist/Technician (FHT) throughout the entire measurement process. Q-View checks quality parameters, including: • Vessel velocity Lost/missing data Other parameters as specified in the rules file
Open the catalog to page 1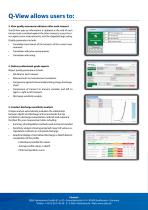
Q-View allows users to: 3. View quality assurance indicators after each transect TranQ-View pop-up information is updated at the end of each transect and correlated against the other transects across the river, against prior measurements, and the stagedischarge rating. Quality parameters include: • Correlation/error bands of the transects of the current measurement Correlation with prior measurements Correlation with rating 4. Deliver professional-grade reports Report quality parameters include: • Q A data for each transect Measurement-to-measurement correlation Comparison against historical...
Open the catalog to page 2All Seba Hydrometrie GmbH & Co. KG catalogs and technical brochures
 Product folder
222 Pages
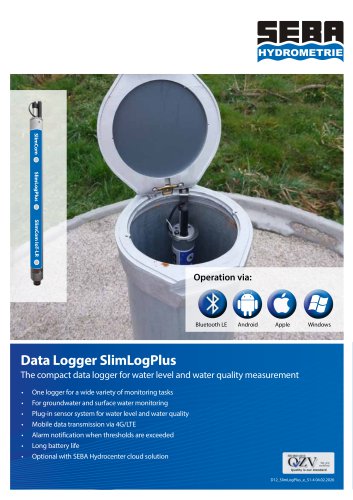 SlimLogPlus
4 Pages
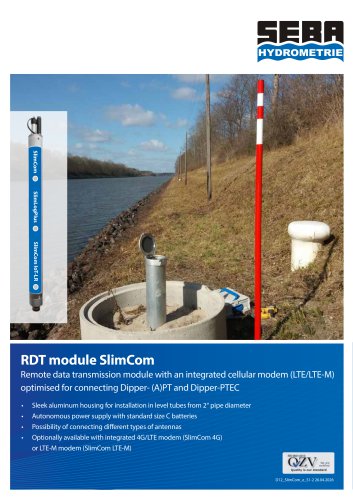 SlimCom
2 Pages
 SlimCom IoT LR
2 Pages
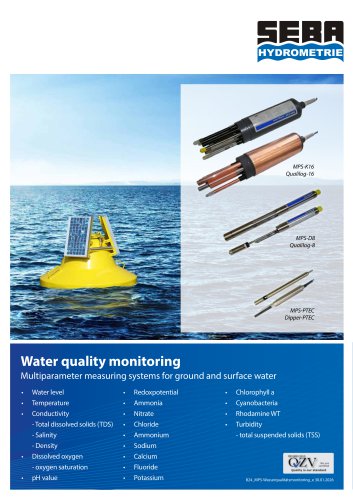 MPS Water quality monitoring
8 Pages
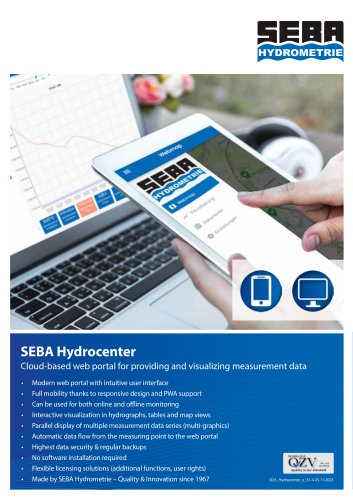 Software Hydrocenter
4 Pages
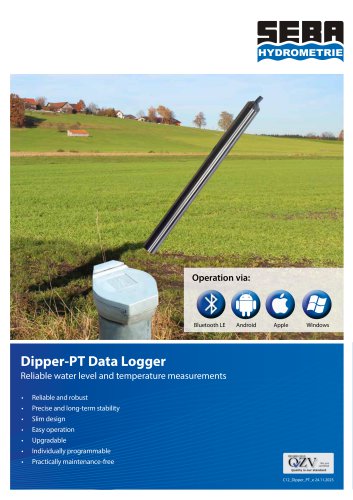 Dipper-PT
8 Pages
 Dipper-PTEC
8 Pages
 Unilog
2 Pages
 LogCom-Q/UnilogCom-Q
4 Pages
 ModCom
2 Pages
 HDA-Tablet
2 Pages
 LogCom/FlashCom
4 Pages
 UnilogCom
2 Pages
 DS (T)
2 Pages
 Radar Sensor Type SEBAPULS
2 Pages
 Software Q4
4 Pages
 PS-Light-2
4 Pages
 FlowFlat
4 Pages
 KLL, KLL-T, KLL-Mini, TLG
4 Pages
 Discharge App
4 Pages
 HDA-Pro
2 Pages
 Mobile bridge jib
2 Pages
 SEBA Cable Way Installations
4 Pages
 KLL-S
KLL-S2 Pages
 Software DEMASole
2 Pages
 LevelSens
2 Pages
 Checker-2
4 Pages
 MultiMET Sensor
2 Pages
 RiverPro ADCP
2 Pages
 Software DEMASvis
2 Pages
 Software DEMASdb
2 Pages
 UnilogLight
2 Pages
 Dipper-APT/BaroDipper
8 Pages
 SEBA Top Pieces
2 Pages
 StreamPro ADCP
4 Pages
 Pneutmatic Gauge PS
4 Pages
 Q-Boat 1800
2 Pages
 Q-Boat 1250
4 Pages
 DischargeKeeper
4 Pages
 RiverRay ADCP
2 Pages
 MPS-TEC
2 Pages
 NetLogCom
8 Pages
 High-Speed Riverboat
2 Pages
 SEBA Staff Gauges
2 Pages
 Nitrate probe SPS NO3
4 Pages
 Channelmaster
2 Pages
 IridiumSat
2 Pages
 Riverboat SP ADCP
2 Pages
 DischargeProcessing
4 Pages
 Wind Sensors AWS
2 Pages
 KLL-(Q)-M1
4 Pages
 KLL-Q-2
4 Pages
 KLL-Light
2 Pages


- LIMING flow meter
- Temperature probe
- LIMING volume flow meter
- Liquid flow monitor
- LIMING measuring instrument
- LIMING gas analyzer
- LIMING management software
- LIMING concentration analyzer
- Data logger
- LIMING analysis software
- Resistance temperature sensor
- LIMING liquids analyzer
- LIMING measuring system
- LIMING level switch
- LIMING crane
- LIMING automatic analyzer
- LIMING Windows software
- Real-time software
- LIMING liquid level switch
- Level probe