- Catalogs
- Seba Hydrometrie GmbH & Co. KG
- Software DEMASvis
Software DEMASvis
1 /2Pages

Software DEMASvis
1 /2Pages
Catalog excerpts

DEMASvis Software tool for visualisation of your measuring data • • • • • • • Evaluation software (Windows) for graphical or tabular display of the measured values is available as a single workstation version (stand-alone) or as a part of software DEMASdb and ConfigPC Modern user interface with graphical operating concept (Ribbons) Hydrographs with zoom and crosslines function Calculation functions (e.g. averaging, extreme value calculation, summation etc.) Hydrograph correction over control values, sensor drift compensation, interpolation Live mode for KLL-Q-2-users, for visualising current data, for example in connection with HDA-Pro Export of data in different formats (eg.ASCII, CSV) D24_DEMASvis_e_S1-2
Open the catalog to page 1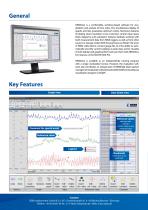
General DEMASvis is a comfortable, windows-based software for visualisation and analysis of time series. The simultaneous display of graphs and lists guarantees optimum clarity. Numerous features (including zoom, transition curve correction, control value input, block diagrams) and calculation features facilitate working with both measurement data from SEBA loggers as well as from other sources or storage media. With the practical „Live Mode“, the users of SEBA cable electric contact gauge KLL-Q-2 the ability to automatically send the current readings as push data, and to visualise in both tabular...
Open the catalog to page 2All Seba Hydrometrie GmbH & Co. KG catalogs and technical brochures
 Product folder
222 Pages
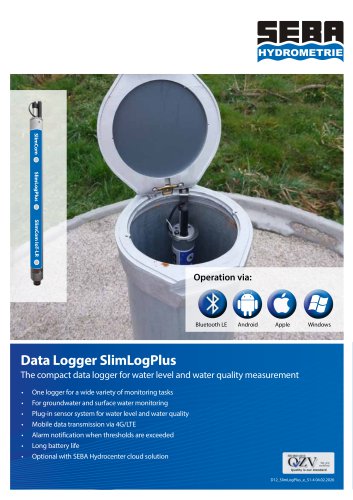 SlimLogPlus
4 Pages
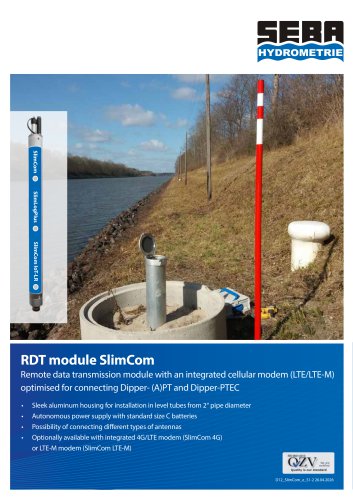 SlimCom
2 Pages
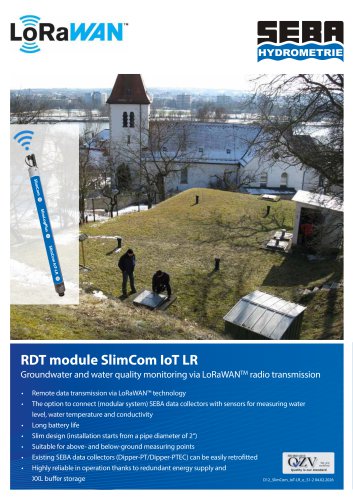 SlimCom IoT LR
2 Pages
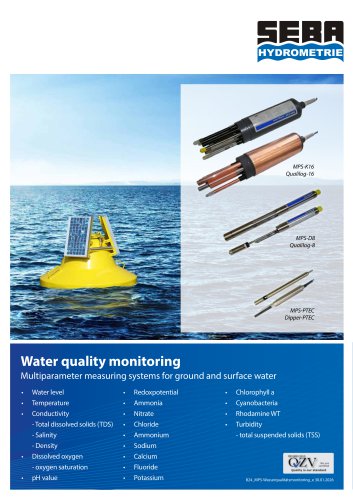 MPS Water quality monitoring
8 Pages
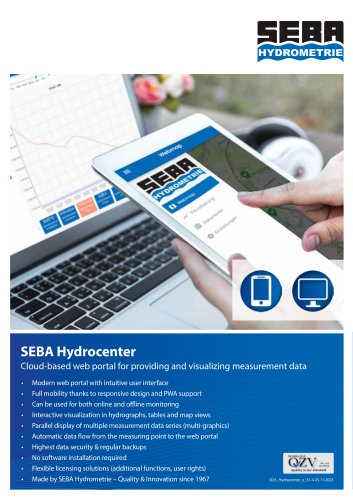 Software Hydrocenter
4 Pages
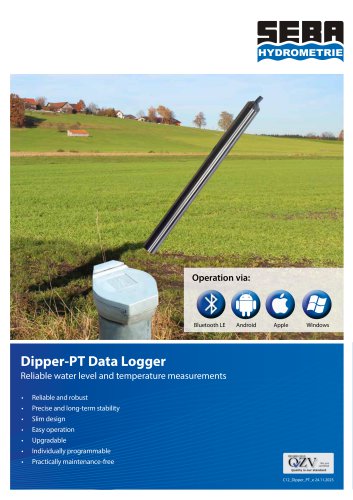 Dipper-PT
8 Pages
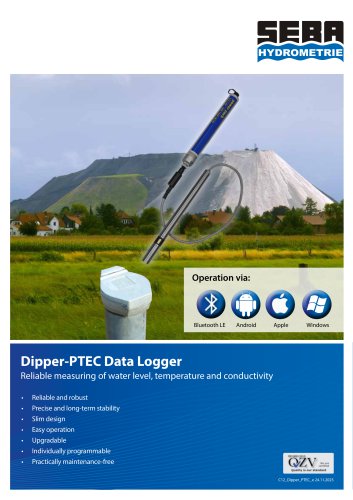 Dipper-PTEC
8 Pages
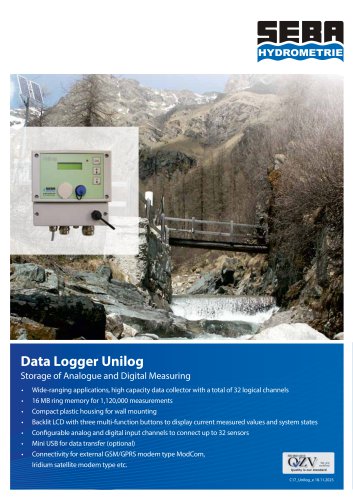 Unilog
2 Pages
 LogCom-Q/UnilogCom-Q
4 Pages
 ModCom
2 Pages
 HDA-Tablet
2 Pages
 LogCom/FlashCom
4 Pages
 UnilogCom
2 Pages
 DS (T)
2 Pages
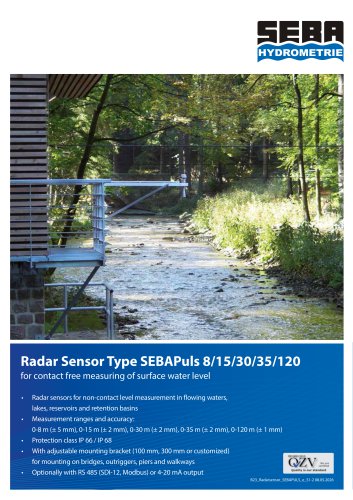 Radar Sensor Type SEBAPULS
2 Pages
 Software Q4
4 Pages
 PS-Light-2
4 Pages
 FlowFlat
4 Pages
 KLL, KLL-T, KLL-Mini, TLG
4 Pages
 Discharge App
4 Pages
 HDA-Pro
2 Pages
 Mobile bridge jib
2 Pages
 SEBA Cable Way Installations
4 Pages
 KLL-S
KLL-S2 Pages
 Software DEMASole
2 Pages
 LevelSens
2 Pages
 Checker-2
4 Pages
 MultiMET Sensor
2 Pages
 RiverPro ADCP
2 Pages
 Software DEMASdb
2 Pages
 UnilogLight
2 Pages
 Dipper-APT/BaroDipper
8 Pages
 SEBA Top Pieces
2 Pages
 StreamPro ADCP
4 Pages
 Pneutmatic Gauge PS
4 Pages
 Q-Boat 1800
2 Pages
 Q-Boat 1250
4 Pages
 DischargeKeeper
4 Pages
 RiverRay ADCP
2 Pages
 MPS-TEC
2 Pages
 NetLogCom
8 Pages
 High-Speed Riverboat
2 Pages
 SEBA Staff Gauges
2 Pages
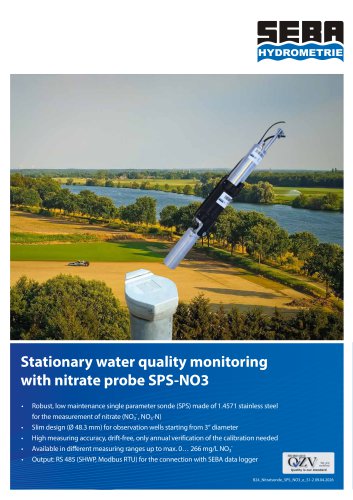 Nitrate probe SPS NO3
4 Pages
 Channelmaster
2 Pages
 IridiumSat
2 Pages
 Riverboat SP ADCP
2 Pages
 Software Q-View
2 Pages
 DischargeProcessing
4 Pages
 Wind Sensors AWS
2 Pages
 KLL-(Q)-M1
4 Pages
 KLL-Q-2
4 Pages
 KLL-Light
2 Pages


- LIMING flow meter
- Temperature probe
- LIMING volume flow meter
- Liquid flow monitor
- LIMING measuring instrument
- LIMING gas analyzer
- LIMING management software
- LIMING concentration analyzer
- Data logger
- LIMING analysis software
- Resistance temperature sensor
- LIMING liquids analyzer
- LIMING measuring system
- LIMING level switch
- LIMING crane
- LIMING automatic analyzer
- LIMING Windows software
- Real-time software
- LIMING liquid level switch
- Level probe