
Catalog excerpts
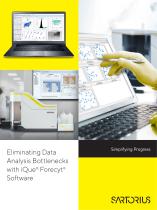
Eliminating Data Analysis Bottlenecks with iQue® Forecyt® Software
Open the catalog to page 1
Interactive Assay Development, Analysis and Multiparametric Data Visualization Forecyt® software, at the heart of the iQue® platform, provides a fully integrated yet easy-to-use interactive assay development, analysis and visualization environment, removing the need to manage and learn multiple software packages. Alongside all the required standard analysis tools required for flow cytometry data, Forecyt® software offers plate-level annotation and data visualization tools not found in traditional flow-based software programs. From the linking of data from multiple wells to the combination...
Open the catalog to page 2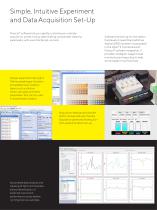
Simple, Intuitive Experiment and Data Acquisition Set-Up Forecyt® software lets you rapidly customize your sample acquisition, probe rinsing, plate shaking, and sampler cleaning parameters, with user-friendly set-up tools. Design experiment tab (right): Define sample type | location and additional annotation layers such as dilution series, cell types and other parameters that can be used in downstream analysis. Acquisition settings and worklist (left): Intuitive and user-friendly acquisition panels facilitate quickstart experimentation set-up. Automated data analysis and tracking of QC...
Open the catalog to page 3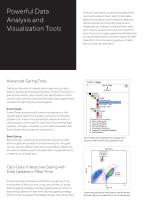
Powerful Data Analysis and Visualization Tools Forecyt® software provides all standard flow cytometry analysis tools, and incorporates plate level analysis and visualization features that accelerate and simplify analysis and interpretation of large, multiparametric data sets. Unique analysis tools quickly transform even the most complex experimental data sets into actionable results, and eliminate the need to perform time consuming analysis of data files on a well-by-well basis. Advanced Gating Tools Gating on the cells of interest within data sets can be a tedious and sometimes daunting...
Open the catalog to page 4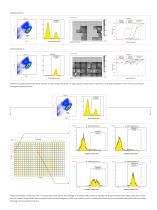
Interactive gating with real-time results: Simply “drag and drop” or adjust gate shape, size, or position, and data updates in real-time according to changes in gate position. Data visualization linked by well: A unique tool that allows the linkage of multiple data views to rapidly verify active wells from large data sets. Data can be viewed at the plate level using dot plots and histograms. Well scan allows users to easily drill down to the individual well level data by simply clicking on the wells of interest
Open the catalog to page 5
Simple Dose-Response Curve Generation Forecyt® software is the only flow cytometry analysis package that can automatically generate dose-response curves, providing a faster time to result by eliminating the need to export your raw data into a separate software package. When linked together with scatter plots or histograms, the impact of changes to gating strategies on dose response curves can be instantly visualized. Dose-response curves for four compounds which induce apoptosis in PBMCs: PBMCs were immunophenotyped into three subpopulations and dose-response curves generated for each...
Open the catalog to page 6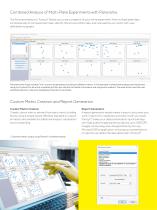
Combined Analysis of Multi-Plate Experiments with Panorama The Panorama feature in Forecyt® allows you to see a snapshot of your entire experiment. View multiple plate data simultaneously to compare heat maps, identify hits across profile maps, and rank wells by any metric with userdefinable line graphs. Panorama view: Easily visualize “hits” across multiple plates according to different metrics. In this example 10 plates were analyzed simultaneously using the Cyclone Plus kit which correlates IgG titer-per-cell with cell health information and cell growth readouts. The wells which meet the...
Open the catalog to page 7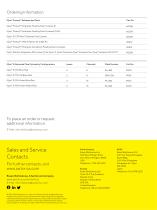
Ordering Information iQue® Forecyt® Software and Tools iQue® Forecyt® Enterprise Floating Client License (1) iQue® Forecyt® Enterprise Floating Client Licenses (5 Pk) iQue® 21 CFR Part 11 Software Tool License iQue® Forecyt® Offline Edition for single PC iQue® Forecyt® Enterprise Including 5 Floating Client Licenses iQue® Robotic Integration API License (1) for iQue® 3, iQue® Screener; iQue® Screener Plus; iQue® Screener HD; HTFC® iQue® 3 Advanced Flow Cytometry Configurations Plate Formats To place an order or request additional information: E-Mail: info.intellicyt@sartorius.com Sales and...
Open the catalog to page 8All Sartorius AG catalogs and technical brochures
-
Picus® and Picus® NxT
8 Pages
-
Univessel® Glass
40 Pages
-
Ambr® Analysis Module
8 Pages
-
Resolute® RCC MU
6 Pages
-
Flexboy 2D Bags
55 Pages
-
iQue® 3
7 Pages
-
Sterisart® NF
4 Pages
-
Vivaflow®
12 Pages
-
Vacusart
2 Pages
-
Sterisart® Sterility Testing
6 Pages
-
Sterisart ® Family
12 Pages
-
Speedcal Mobile
2 Pages
-
Sartocheck® 5 Plus Filter Tester
26 Pages
-
Quintix® and Secura®
24 Pages
-
Rline® Dispenser Module
4 Pages
-
Midi Plus Pipette Controller
4 Pages
-
MA160 Moisture Analyzer
8 Pages
-
Filter Papers
36 Pages
-
Cubis® II
12 Pages
-
Claristep® Filtration System
12 Pages
-
Arium® Mini
11 Pages
-
Midi Plus
4 Pages
-
Microbiological QC Solutions
12 Pages
-
Practum®
8 Pages
-
Entris®
4 Pages
-
Cubis® MCM10K3
4 Pages
-
Quintix®
12 Pages
-
Laboratory Weighing Products
96 Pages
-
Laboratory Filtration Products
123 Pages
-
Products for Microbiological Control
120 Pages


