- Catalogs
- RULA Technologies
- VisAnalyser Software
VisAnalyser Software
1 /16Pages

VisAnalyser Software
1 /16Pages
Catalog excerpts

VisAnalyser Software
Open the catalog to page 1
VisAnalyser Software VisAnalyser is a powerful program complex intended to record and analyze signals of different dynamic processes. The sources of signals can be different: the data can come from DAQ devices in real-time or from a recorded file. It is possible to analyze the data acquired with RULA devices or imported from other acquisition systems. Possible Applications • Viewing the waveform of the recorded signal; Spectrum graphs: calculation of spectrum density, RMS or amplitude spectrum; • Statistical analysis: calculating RMS, median, minimum • Filtration with FIR or IIR filters. You...
Open the catalog to page 3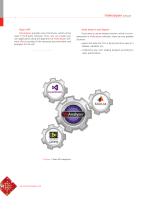
Data Import and Export VisAnalyser provides a set of functions, which can be used in third-party software. Thus, you can create your own applications using the algorithms of VisAnalyser software. RULA provides all the necessary documentation and examples for the API. If you want to use an analysis function, which is not implemented in VisAnalyser software, there are two possible solutions: export the data into CSV or binary format to view it in Matlab, LabVIEW, etc.; implement your own reading program according to open specificatio
Open the catalog to page 4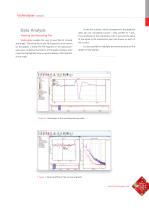
Data Analysis Viewing the Recording File VisAnalyser enables the user to view files of virtually any length. The whole file or any file fragment can be shown on the graphs. Choose the file fragment in the special preview area, located at the bottom of the graph window, then move the highlighted zone to quickly display a file fragment at any scale. To see the numbers, which correspond to the graphical data, you can use special cursors – lines, parallel to Y axis. The coordinate of the intersection with X axis and the value of the signal at the intersection point are shown on each of the cursors....
Open the catalog to page 5
Spectrum Analysis The user can calculate power spectrum density of the signal, view the RMS and amplitude spectra. For spectrum analysis, you can specify: • Window length; Window function – Hann, Hemming, Blackman, Newtall, flat-top, Kaiser, Bohmann, Chebyshev; Averaging type – linear or exponential; Zero offset calculation and subtraction. 4Figure 4. Spectrum analysis settings 4Figure 5. Results of part-octave analysis «RULA Technologies», SIA Spectrum analysis can be used for vibration diagnostics of machines and mechanisms, finding the source of vibration, finding the differences in the vibration...
Open the catalog to page 6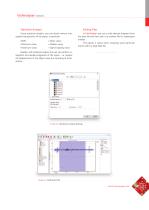
Statistical Analysis Editing Files Using statistical analysis, you can obtain various integrated characteristics of the signal, in particular: • Mean value; Minimum value; Median value; Maximum value; In VisAnalyser you can cut the relevant fragment from the data file and then save it as another file for subsequent analysis. Sigma-clipping value. This option is useful when analyzing some particular events within a large data file. Besides, with statistical analysis the user can perform integration and double-integration of the signal – i.e. analyze the displacement of the object using the recording...
Open the catalog to page 7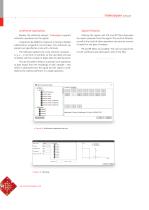
Arithmetic Operations Besides the statistical analysis, VisAnalyser supports arithmetic operations on the signals. A signal can be added to a signal or a constant, divided, subtracted or a logarithm can be taken. The arithmetic operations are specified as a line with a formula. The software supports the most common constants – π, g, e – in the form of symbols, so the user does not have to bother with the number of digits after the decimal point. The use of patterns helps to automate such operations as data import from the recordings of ADC samples – zero offset is subtracted from the signal and...
Open the catalog to page 8
This type of analysis has the following settings: • VisAnalyser is able to calculate shock response spectrum (shock response spectrum is defined as the response to a given acceleration acting at a set of mass-damper-spring oscillators, which are adjusted to the different resonance frequencies while their resonance gains (Q-factor) are equal) based on the file with data. Frequency range; Damping factor and Q-factor; Wavelet frequency setting - linear or logarithmic; Frequency step. The results of this analysis can be used to compare and identify shock impacts and in seismic analysis. «RULA Technologies...
Open the catalog to page 9
Additional Options Besides the most common types of analysis, VisAnalyser supports a number of highly specialized operations used for various types of balancing and data analysis from tacho-sensors. Tacho-Analysis With this type of analysis, the user can see the following parameters: • rotation frequencies; phases of signals from accelerometers referenced to the signal from the tacho-sensor; imbalance vector. The results of tacho-analysis can be imported to the balancing calculator and balancing wizard. 4Figure 11. Imbalance calculation settings 4Figure 12. The result of imbalance calcul
Open the catalog to page 10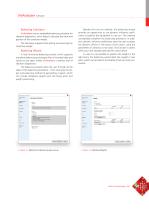
Balancing Calculator VisAnalyser has an embedded balancing calculator for vibration diagnostics, which helps to calculate the value and position of the corrective weight. The calculator supports both setting and removing the corrective weight. Balancing Wizard A fully functional balancing wizard, which supports one-plane balancing and accepts files of recorded data and values as raw data, makes VisAnalyzer a perfect tool of vibration diagnostics. Besides the trial run method, the balancing wizard provides an opportunity to use dynamic influence coefficients to balance the equipment in one run....
Open the catalog to page 11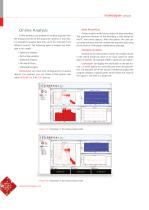
Online Analysis Online analysis is the analysis of the data acquired from the analog channels of the acquisition systems in real time. It is possible to analyze data from up to 512 channels from different sources. The following types of analysis are available in this mode: • Spectrum analysis; Part-octave analysis; Statistical analysis; Waterwall analysis. VisAnalyser can work with configurations of several devices. For example, you can create a DAQ system with either 8 RL-R19 or 8 RL-C21 devices. Data Recording Online analysis mode has an option of data recording. The maximum duration of the...
Open the catalog to page 12All RULA Technologies catalogs and technical brochures
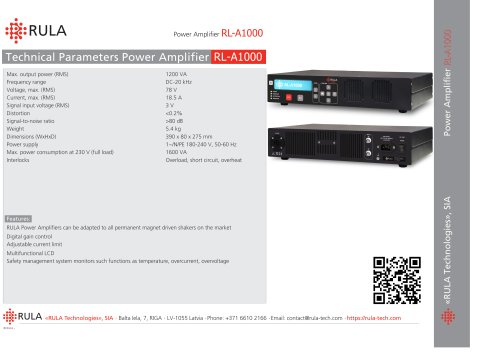 RL-A1000
1 Page
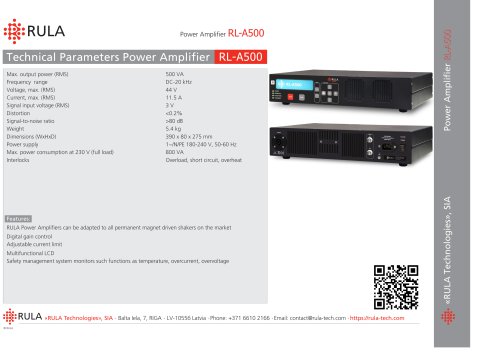 RL-A500
1 Page
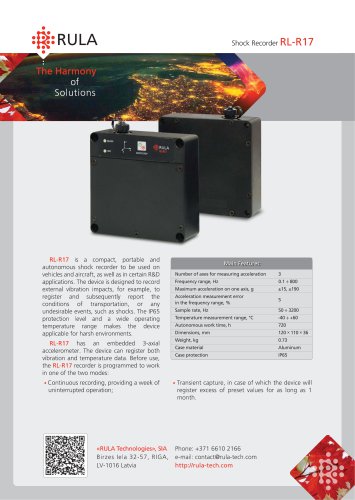 RL-R17
2 Pages
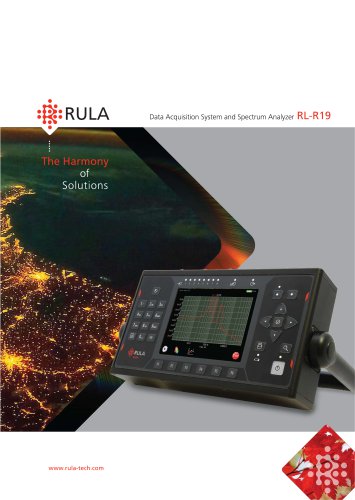
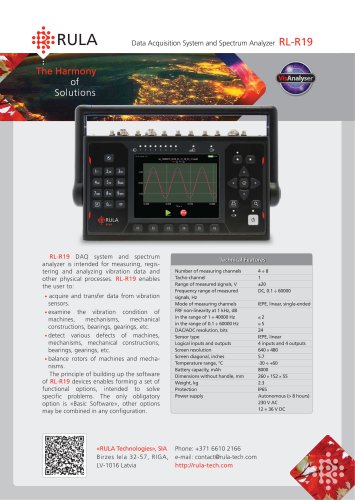 RL-R19
2 Pages
 RL-C25
2 Pages
 RL-C21
2 Pages
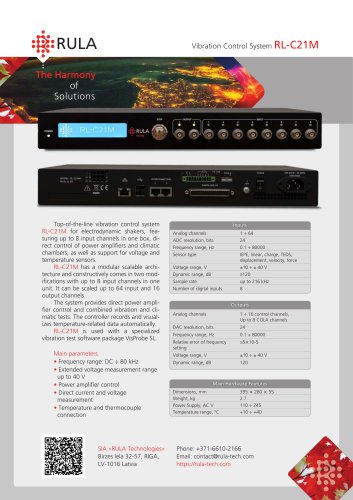 RL-C21M
2 Pages
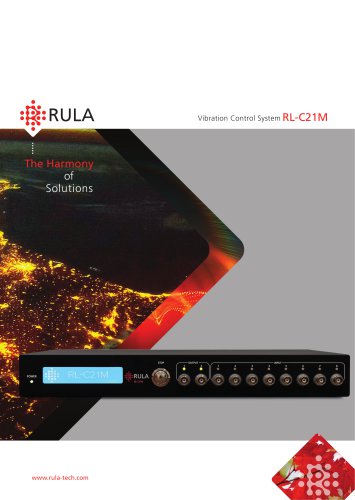 Vibration Control System RL-C21M
20 Pages
 Vibration Control System RL-C21
20 Pages

- Monitoring analyzer
- Analysis software solution
- Process software
- Automatic analyser
- Windows software
- Cloud-based software
- Portable analyzer
- Industrial software
- Interface software
- Measurement software
- Signal amplifying integrated circuit
- Visualization software solution
- Automated software
- Digital analyzer
- Waterproof analyzer
- Power amplifying integrated circuit
- Test software
- 2D software
- Data acquisition unit
- Data acquisition software