- Catalogs
- RULA Technologies
- Data Acquisition System and Spectrum Analyzer RL-R19
Data Acquisition System and Spectrum Analyzer RL-R19
1 /16Pages
Data Acquisition System and Spectrum Analyzer RL-R19
1 /16Pages
Catalog excerpts
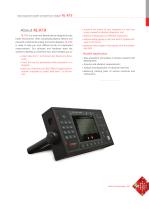
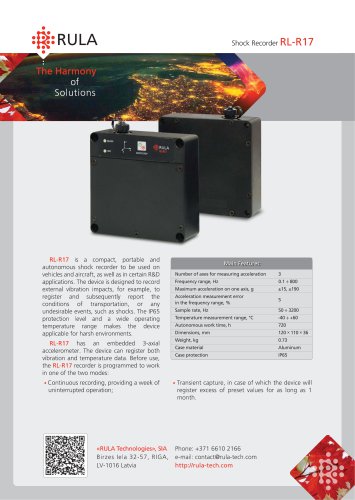
Data Acquisition System and Spectrum Analyzer RL-R19 3 About RL-R19 RL-R19 is a smart and flexible device designed for the harsh environment. With outstanding battery lifetime and powerful multichannel analog-front-end subsystem, RL-R19 is ready to help you with different kinds of complicated measurements. Our software and hardware team has worked to develop a convenient tool, which enables you to: examine the health of your equipment in real time using a powerful vibration diagnostic tool; balance rotating parts of different equipment; • analyze analog signals in real time with FFT-based soft-...
Open the catalog to page 3
Data Acquisition System and Spectrum Analyzer RL-R19 Key features Operation Modes RL-R19 device can operate in one of the two modes: DAQ system and Signal Analyzer. In the DAQ system mode the device enables you to: • collect signals; • transfer data to PC for subsequent or online processing. The Signal Analyzer mode allows the user to: • make measurements, register and analyze data; • perform various types of spectral analysis; • perform diagnostics of possible equipment defects (in bearings, gearings, etc.); • perform dynamic balancing of rotors and rotating parts. Sensors RL-R19 works with...
Open the catalog to page 4
Data Acquisition System and Spectrum Analyzer RL-R19 5 4Figure 1. RL-R19 DAQ system and spectrum analyzer
Open the catalog to page 5
Data Acquisition System and Spectrum Analyzer RL-R19 6 Technical Features Inputs and Outputs Number of input measuring channels Number of input tacho-channels Number of output channels DC DC measurement range, V Relative error of DC voltage, % Frequencies Frequency range, Hz Relative error of frequency measurement, % Sample rate, Hz Rotation frequency range, RPM AC RMS voltage range, V FRF non-linearity of inputs, %, not more than: • in the frequency range from 1 Hz to 40 kHz • in the frequency range from 0.1 Hz to 60 kHz THD range (frequency from 20 to 5000 Hz), % Absolute THD error, % Measurement...
Open the catalog to page 6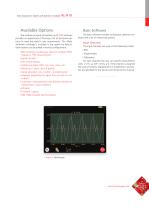
Data Acquisition System and Spectrum Analyzer RL-R19 Available Options The modular principle of building up RL-R19 software provides an opportunity of forming a set of functional options to meet any specific user requirements. The «Basic Software» package is included in the system by default, other options can be added in various configurations. • Basic Software: oscilloscope, spectrum analyzer; RMS, frequency, THD measurements; • Signal recorder; • Part-octave analysis; • Statistical analysis: RMS, min, max, mean, etc.; • Balancing (1 plane, up to 8 points); • Signal generator: sine, random,...
Open the catalog to page 7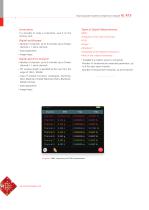
Data Acquisition System and Spectrum Analyzer RL-R19 Screenshots It is possible to make a screenshot, save it on the memory card. Digital oscilloscope • Number of channels: up to 9 channels (up to 8 basic channels + 1 tacho-channel); • Scale adjustment; • Image freeze. Digital spectrum analyzer • Number of channels: up to 9 channels (up to 8 basic channels + 1 tacho-channel); • FFT window length is specified by the user from the range of 1024 - 65536; • Type of window functions: rectangular, Hamming, Hann, Blackman, Nuttall, Blackman-Harris, Blackman-Nuttall, flat-top; • Scale adjustment; • Image...
Open the catalog to page 8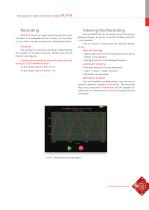
Data Acquisition System and Spectrum Analyzer RL-R19 9 With RL-R19 you can easily record signals from input channels to the embedded SD-card. Simply turn the device on, set up the channels and press the «Recording» button. Any recording file can be viewed using VisAnalyser desktop software, as well as on the RL-R19 device itself (PC is not required). You can choose to review only the channels relevant to you. Duration The duration of continuous recording is determined by the number of recording channels, sample rate and the memory card capacity. Manual Viewing • Continuous recording time (on...
Open the catalog to page 9
Data Acquisition System and Spectrum Analyzer RL-R19 10 Part-Octave Analysis Part-octave analysis enables calculating a part-octave spectrogram: 1/1, 1/3, 1/6, 1/12 octave. Statistical Analysis Statistical analysis shows the plots of the following signal parameters from time: • minimum value; maximum value; Balancing RL-R19 provides the function of balancing rotors, shafts, blades, propellers and other rotating junctions of machines and mechanisms. «Balancing Calculator» RL-R19 has a «balancing calculator» function, in which the vibration value is not measured by RL-R19. Additional Option VisAnalyser...
Open the catalog to page 10
Data Acquisition System and Spectrum Analyzer RL-R19 11 Output Signal Generator RL-R19 is equipped with an advanced-segment 24-bit DAC, so it is able to generate a signal of complicated shape with the preset parameters. Work Modes The generator may operate in one of the three modes: • Sine – frequency, RMS, THD and the numbers of harmonicas are specified; Random – RMS and frequency range are specified; • User-defined (from the file) – the user is able to choose one of the previously recorded signals and reproduce it on the device. Transient Capture Transient Capture option provides the possibility...
Open the catalog to page 11
Data Acquisition System and Spectrum Analyzer RL-R19 Desktop Software VisAnalyser VisAnalyser desktop software is a powerful program complex intended for the detailed analysis of recordings made with RL-R19 or other RULA devices. VisAnalyser has an expanded graphical subsystem, providing: • a convenient contextual menu; • a possibility to represent several graphs in one window; • autoscale; • unlimited number of user cursors; • additional grid lines; • textual notes. Integration with RL-R19 The software is able to work with RL-R19 files and create reports, based on the measurement results received...
Open the catalog to page 12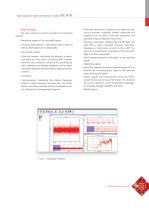
Data Acquisition System and Spectrum Analyzer RL-R19 13 Data Analysis Arithmetic operations: a signal can be added to a signal or a constant, multiplied, divided, subtracted or a logarithm can be taken; arithmetic operations are specified using an equation constructor; Filtering: VisAnalyser supports FIR and IIR filters. For each filter a type is specified: low-pass, high-pass, band-pass or band-stop, as well as the cutoff frequency (or frequencies), sharpness of the transition edge and other parameters; Shock response spectrum calculation of the specified signal; The data analysis function provides...
Open the catalog to page 13All RULA Technologies catalogs and technical brochures
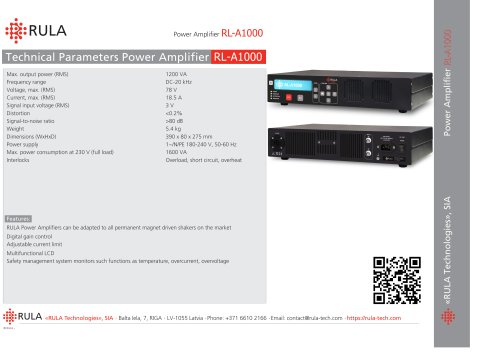 RL-A1000
1 Page
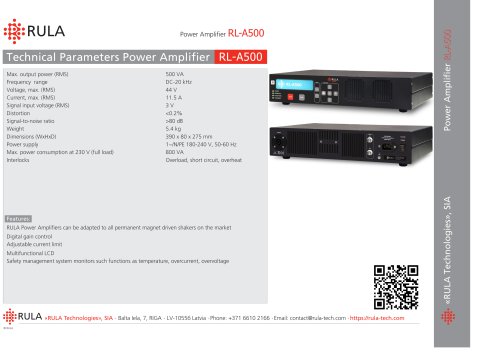 RL-A500
1 Page
 RL-R17
2 Pages
 RL-R19
2 Pages
 RL-C25
2 Pages
 RL-C21
2 Pages
 RL-C21M
2 Pages
 VisAnalyser Software
16 Pages
 Vibration Control System RL-C21M
20 Pages
 Vibration Control System RL-C21
20 Pages

- Monitoring analyzer
- Analysis software solution
- Process software
- Automatic analyser
- Windows software
- Cloud-based software
- Portable analyzer
- Industrial software
- Interface software
- Measurement software
- Signal amplifying integrated circuit
- Visualization software solution
- Automated software
- Digital analyzer
- Waterproof analyzer
- Power amplifying integrated circuit
- Test software
- 2D software
- Data acquisition software