- Catalogs
- Raptor Photonics
- NINOX 640
- Products
- Catalogs
- News & Trends
- Exhibitions
NINOX 640
1 /11Pages

NINOX 640
1 /11Pages
Catalog excerpts
High Performance SWIR Imaging Cameras Introduction to SWIR Imaging Silicon based area detectors (e.g. CCDs or CMOS) are widely used in high performance imaging applications, detecting wavelengths from soft x-ray through to near infrared (NIR). Typically the quantum efficiency (QE) of these detectors decreases rapidly as the detection wavelength increases further into the NIR region. Detector Material Typical VIS-IR Detection Range Indium Gallium Table 1: Common detector materials and their typical detection range within the VIS-IR wavelength Above llOOnm, Silicon is transparent and therefore cannot be used to detect photons of these wavelengths, however many other materials do have photon sensitivity at these wavelengths and longer, see Table 1. The materials listed have been developed into detection systems which enable images to be acquired within the various regions of the visible to infrared spectrum. The typical definition for each 'sub-region' within VIS-IR wavelength range is outlined in Figure 1. Each of the materials above present their own advantages and challenges and therefore prior to detector selection the user must consider all aspects of the intended application, in addition to simply the wavelength response. Figure 1: The typical definition of the various sub-regions of the electromagnetic spectrum, covering visible through to infrared wavelengths. The use of imaging systems to capture long wavelength photons (beyond the detection range of Silicon based devices) continues to increase in many diverse application areas, such as life sciences, security & surveillance, non-destructive testing, quality control and astronomy. This paper will be restricted to a discussion of the performance of InGaAs detector arrays, sensitive in the VIS-SWIR region, i.e. (400- Headquarters: Willowbank Business Park, Larne, Co. Antrim, BT40 2SF Northern Ireland
Open the catalog to page 1
White Paper - High Performance SWIR Imaging Cameras (Dec'14) Brief Overview of InGaAs Detector Arrays Detector Construction InGaAs is a semiconductor material which is an alloy of Indium Arsenide (InAs) and Gallium Arsenide (GaAs). Detector arrays are produced by growing an epitaxial layer of InGaAs on an Indium Phosphide (InP) substrate, with a thin passivation layer of InP grown on top of the InGaAs. The doped substrate and InGaAs layer are used to construct a photodiode array (PDA) which delivers photosensitivity, typically for wavelengths between (900 - 1700) nm. The photodiode array is then...
Open the catalog to page 2
White Paper - High Performance SWIR Imaging Cameras (Dec’14) Detector Performance The inherent complexity of manufacturing this type of imaging device limits the pixel sizes available to relatively large dimensions, typically >10µm and can result in both low manufacturing yields and the presence of defective / non-operational pixels within the final device. Available array sizes are small, when compared to CCDs / CMOS imaging devices, the largest, widely-available array size is currently 640 x 512 pixels. The manufacturing complexity associated with producing a high performance InGaAs FPA, translates...
Open the catalog to page 3
White Paper - High Performance SWIR Imaging Cameras (Dec’14) Inferior ROIC architectures and designs can necessitate deeper cooling of the sensor to achieve comparable dark current performance. These cryogenic / deep-cooled camera systems are typically physically much larger in size, significantly more expensive and result in much larger shifts in the long wavelength response cut-off. The final camera performance is determined by a combination of the quality of the InGaAs PDA and the performance of the CMOS ROIC, in addition to the design and implementation of the camera electronics and firmware....
Open the catalog to page 4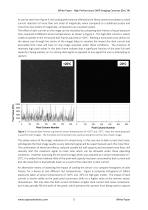
White Paper - High Performance SWIR Imaging Cameras (Dec’14) As can be seen from Figure 4, the cooling performance offered by the Ninox camera translates to a dark current reduction of more than one order of magnitude, when compared to a stabilized system and more than two orders of magnitude, compared to an uncooled system. The effect of dark current on the image can be visualized by comparing dark frames of equal exposure time, acquired at different sensor temperatures, as shown in Figure 5. The high dark current is clearly visible as speckle in the 10 second dark frame acquired at +20°C. Plotting...
Open the catalog to page 5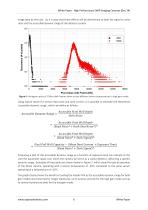
White Paper - High Performance SWIR Imaging Cameras (Dec’14) image data by the user. So it is clear that these effects will be detrimental to both the signal to noise ratio and the accessible dynamic range of the detector system. Figure 6: Histogram plots of 100ms dark frames taken at two different sensor temperatures in high gain mode. Using typical values for sensor read noise and dark current, it is possible to estimate the theoretical ‘accessible dynamic range’, which we define as follows: ݐݑаݑаݑҰݑ0ݑ0ݑְݑϰݑٰݑ Ұݐװݑưݑ۰ݑΰݑڰݑְݑ аݑŰݑΰݑ۰ݑݑ = ҰݐݑаݑаݑҰݑ0ݑ0ݑְݑϰݑٰݑ ҰݑðݑְݑŰݑҰݑ ٰݑʰݑҰݑٰݑ ٰݐװݑҰݑݰݑbĎ...
Open the catalog to page 6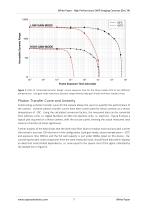
White Paper - High Performance SWIR Imaging Cameras (Dec’14) Figure 7: Plots of ‘Accessible Dynamic Range’ versus exposure time for the Ninox InGaAs FPA at two different temperatures. Low gain mode maximizes dynamic range whereas high gain mode minimizes readout noise. Photon Transfer Curve and Linearity Constructing a photon transfer curve for the camera allows the users to quantify the performance of the camera. Variance photon transfer curves have been constructed for Ninox cameras at a sensor temperature of -20C. Using the calculated conversion factors, the measured data can be converted...
Open the catalog to page 7
White Paper - High Performance SWIR Imaging Cameras (Dec'14) • Total Measured Noise ----Expected Photon Shot Noise (i.e signal ') □ Total Dark Noise = 152 e- rms A Measured Noise (excluding Dark Noise) Mean Signal per Pixel (e-) Figure 8: Sample Photon Transfer Plot for Ninox camera, acquired in low gain mode with the sensor cooled to -20°C and an exposure time of 300ms. Excellent agreement between measured and theoretical shot noise performance across the entire range of measured signals. As can be seen from the graph there is excellent agreement between the theoretical line and the experimental...
Open the catalog to page 8All Raptor Photonics catalogs and technical brochures
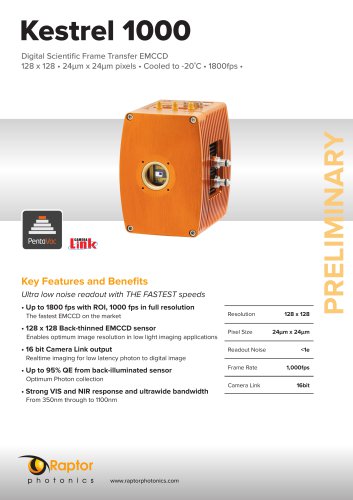 Kestrel 1000
2 Pages
 Hawk EM247
2 Pages
 Osprey OS4MPc-CL
2 Pages
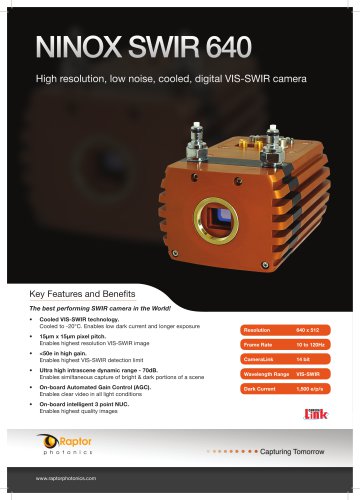 Ninox SWIR 640
2 Pages
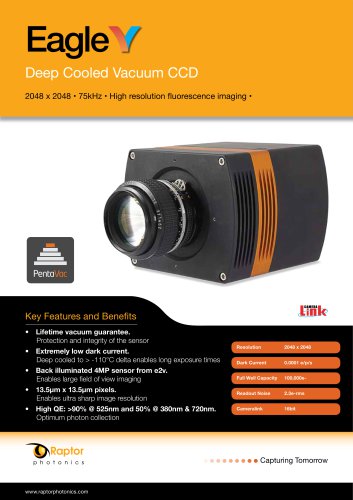 Eagle V
2 Pages
 OWL SW1.7HS
2 Pages
 OWL 1.7-CL-320
2 Pages
 Cygnet RGB
2 Pages
 Cygnet Monochrome
2 Pages
 Kingfisher V
2 Pages
 Falcon
2 Pages
 Falcon BLUE
2 Pages
 Hawk EMCCD
2 Pages
 Kingfisher CCD
2 Pages
 Kite EMCCD
2 Pages
 Osprey sCMOS RGB
2 Pages
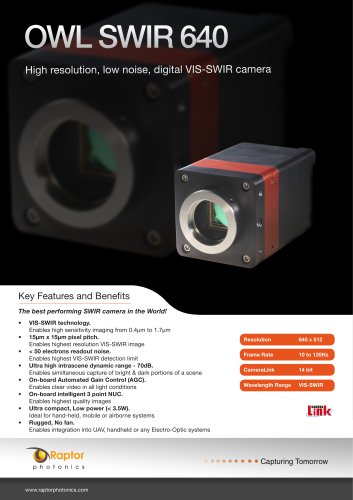
 OWL SWIR 640
2 Pages
- Digital imager
- Visible imager
- CMOS camera module
- Infrared imager
- Monitoring camera system
- Full-color camera system
- Image processing camera module
- Monochrome camera module
- GigE Vision camera
- HD camera module
- Thermographic camera
- Temperature-controlled camera
- High-speed camera module
- CCD video camera
- Camera for scientific applications
- Laboratory camera module
- High-sensitivity video camera
- Spark optical emission camera module
- Low light camera module
- Ultra-high resolution camera