- Catalogs
- QAWRUMS Ltd.
- Acoustic Emission Sensor Calibration Standard Transfer Flow Chart
- Company
- Products
- Catalogs
- News & Trends
- Exhibitions
Acoustic Emission Sensor Calibration Standard Transfer Flow Chart
1 /7Pages

Acoustic Emission Sensor Calibration Standard Transfer Flow Chart
1 /7Pages
Catalog excerpts

Brief introduction of acoustic emission sensor calibration system of QingCheng AE Institute(GuangZhou) Co.,ltd Acoustic Emission Sensor Calibration Standard Transfer Flow Chart Signal generator sends out electric pulse to excite transducer to send out vibration signal on the first level test bench LOREM Dopple Laser interference vibrometer who works as a first-class standard receiver receives vibration signal. Level II standard sensor to be calibrated of Qingcheng company receives vibration signal. By signal spectrum analysis,the original signal of transducer and the bandwidth distribution of test platform are obtained. Through signal spectrum analysis,the received signal bandwidth of the sensor to be calibrated is obtained. Excluding the original signal of transducer and inhomogeneities of bandwidth transmitted by test bench, the real bandwidth of the sensor to be calibrated is obtained. The measured sensor generates a secondary standard sensor, and the corresponding first class calibration values are saved synchronously. Vibration signals are generated from broken glass tube on secondary calibration test bench. Secondary standard sensor receives vibration signal. Mass production sensor to be tested receive vibration signal. The receiving bandwidth of the second standard sensor is obtained by analyzing the signal spectrum. The receiving bandwidth of sensors to be tested in mass production is obtained by signal spectrum analysis. Calculate the deviation between the bandwidth of this signal of the standard sensor and the primary calibration standard value as the calibration coefficient Calculate the real bandwidth of the mass production sensor by using the bandwidth calibration coefficient of this measurement and the receiving bandwidth of the mass production sensor. 1
Open the catalog to page 1
1. According to ISO12713 (ASTM e1106, GB / t19800), the first level calibration of acoustic emission sensor is carried out by speed method。 1.1 The sensors to be calibrated selected by QingCheng company shall be calibrated by China Metrology Institute at the first level. 1.2 China Metrology Institute uses signal generator to send excitation electric signal, high frequency transducer as signal source to send vibration signal for calibration. 1.3 The standard receiving equipment adopts the Doppler laser interference vibrometer as the first level standard receiver to receive the vibration signal,...
Open the catalog to page 2
1.4 The sensor to be calibrated and the standard receiver receive the signal from the same signal source synchronously, and use another channel of the oscilloscope to receive the signal, the unit is voltage (V), do spectrum analysis and record. 1.5 According to the 1 V corresponding to 1 m / s as 0 dB reference, convert the voltage equivalent of the calibrated sensor corresponding to the receiving speed equivalent of each frequency point of the interference vibrometer in the frequency domain to the DB value。
Open the catalog to page 3
1.6 The DB value of each frequency point in the frequency domain corresponding to the calibrated sensor shall be archived, the curve shall be drawn, and the standard sensor shall be generated as the secondary calibrated standard sensor 2. According to iso12714 (ASTM e1781, GB / t19801), the standard sensor calibrated by the Metrology Institute is used for secondary calibration by QingCheng company 2.1 QingCheng AE Institute(GuangZhou) Co.,ltd. has developed and designed the sensor calibration system, which is composed of test bench、 acquisition instrument and test software.
Open the catalog to page 4
2.2 On the test bench, use 0.3mm hollow glass tube to send out vibration signal for calibration 2.3 The standard sensor receives the signal by using the special acquisition card of QingCheng company , uses the special test software of QingCheng company to do spectrum analysis, directly converts to DB value and records.
Open the catalog to page 5
2.4 The sensor to be calibrated and the standard sensor receive the signal from the same signal source synchronously, and the other channel of the acquisition card receives the signal. The special test software is used for spectrum analysis, which is directly converted to DB value and recorded。 2.5 Using the spectrum value of the standard sensor given by the Metrology Institute,subtracting the standard sensor’s spectrum value of the received signal of this test ,thus generate the calibration coefficient of each frequency point of this measurement.
Open the catalog to page 6
2.6 Adding the spectrum value which was received by the calibrated sensor of this test to the calibration coefficient described in the pragrahp 1.5 , then obtain the secondary calibration value of each frequency point in the corresponding frequency domain, archive, draw the curve and deliver it to the user for reference.
Open the catalog to page 7All QAWRUMS Ltd. catalogs and technical brochures
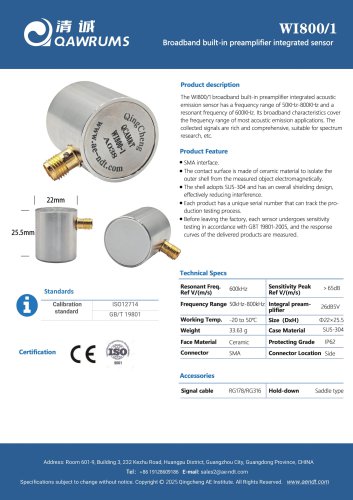 WI800-1
1 Page
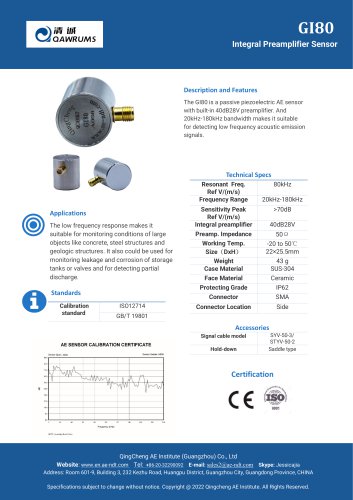 GI80
GI801 Page
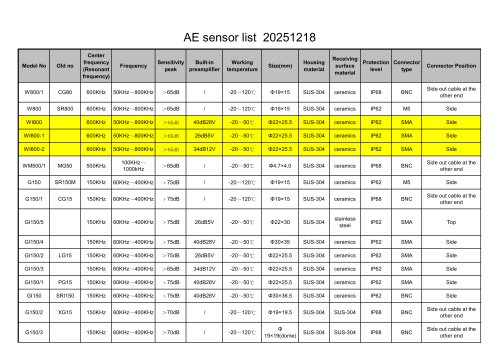 Sensor Selection List
4 Pages
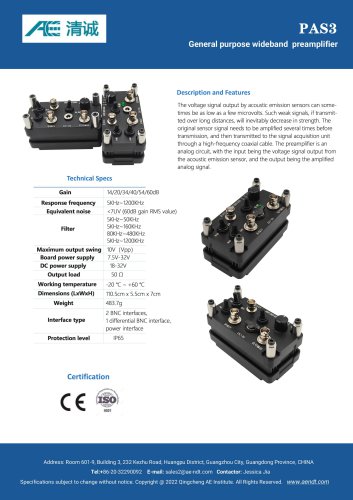 PAS3
PAS32 Pages
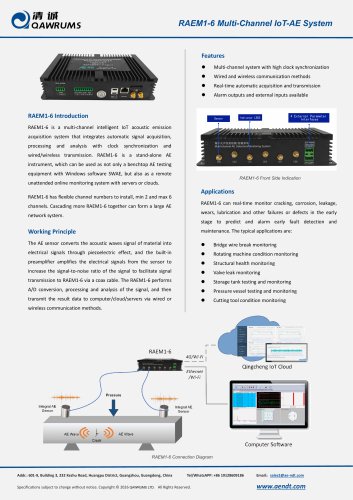 RAEM1-6 Data Sheet
2 Pages
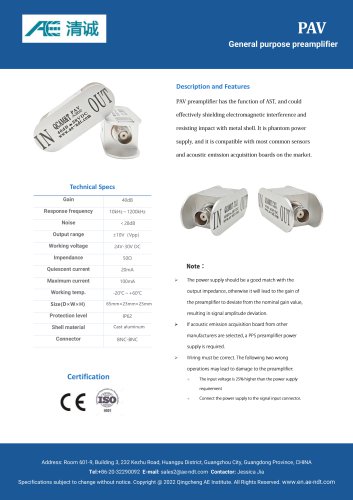 PAV datasheet
1 Page
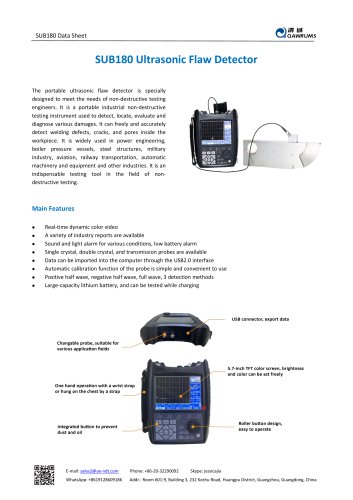 SUB180 Data sheet
3 Pages
 WM500-1
1 Page
 WI500-1
1 Page
 WI500
WI5001 Page
 W800-1
1 Page
 W800
W8001 Page
 W500-1
1 Page
 W500
W5001 Page
 LS5VDCB
1 Page
 LS5VDCA
1 Page
 GSI150
1 Page
 GM150-1
1 Page
 GM150
GM1501 Page
 GIS35
GIS351 Page
 GI150-4
1 Page
 GI150-3
1 Page
 GI150-2
1 Page
 GI150-1
1 Page
 GI150
GI1501 Page
 GI40-2
1 Page
 GI40
GI401 Page
 GI35-2
1 Page
 GI35-1
1 Page
 GI35
GI351 Page
 GI10-1
1 Page
 GI10
GI101 Page
 GH150-2
1 Page
 GH150-1
1 Page
 GH150
GH1501 Page
 GD150
GD1501 Page
 GD40
GD401 Page
 G150-2
1 Page
 G150-1
1 Page
 G150
G1501 Page
 G80-1
G80-11 Page
 G80
G801 Page
 G40
G401 Page
 G10-1
G10-11 Page
 G10
G101 Page
 RAEM1 Datasheet
2 Pages
 RAEM2 Datasheet
3 Pages
 SAEU3H Datasheet
2 Pages


- Power supply unit
- DC power supply
- AC/DC power supply
- Electrical cable
- Automation software solution
- Copper cable
- Copper electrical cable
- Analysis software solution
- Power cable
- Process software
- Windows software
- Real-time software
- Cloud-based software
- Calibration system
- Insulated cable
- Insulated electrical cable
- Single-output power supply
- Multi-strand cable
- Multi-wire electrical cable
- Power supply for industrial applications