- Catalogs
- Princeton Instruments Acton
- Monochromators & Spectrographs
Monochromators & Spectrographs

Monochromators & Spectrographs
Catalog excerpts

Technical Note SPECTROSCOPY GROUP Improved Spectra with a Schmidt-Czerny-Turner Spectrograph © 2013 Princeton Instruments, Inc. All rights reserved. For years spectra have been measured using traditional Czerny-Turner (CT) design dispersive spectrographs. Optical aberrations inherent in the CT design can give spectra with poor spectral resolution, low signal-to-noise ratios (SNR) and distorted peak shapes. These aberrations grow worse towards the edges of the focal plane, causing some researchers to abandon these regions of their sensors. A new dispersive spectrograph using a Schmidt-Czerny-Turner (SCT) design greatly reduces optical aberrations giving spectra with better spectral resolution, signal-to-noise ratios and peak shapes. The performance of this spectrograph is excellent across the focal plane so researchers can now use an entire CCD sensor to take their data. For decades dispersive spectra have been measured using the traditional Czerny-Turner (CT) spectrograph design seen in Figure 1. In the CT design light passes through an entrance slit, reflects off a collimating mirror, is dispersed by a diffraction grating and is then brought to a focus by a focusing mirror at the focal plane of the instrument. Entrance Slit Light Source Diffraction Grating Focusing Mirror The fluence of an optical system such as a spectrograph is defined as the number of photons hitting a unit area as such: Φ = N/A Where Φ = Fluence N = Number of photons A = Area, typically measured in cm2 or meters2 Collimating Mirror Focal Plane Figure 1. The optical layout of a traditional Czerny-Turner spectrograph (not to scale).
Open the catalog to page 1
SPECTROSCOPY GROUP For a spectrograph this area can be the number of pixels illuminated on a charge coupled device (CCD) sensor. A high fluence spectrograph has many photons striking few pixels. This means the light is less spread out on the x axis giving narrower peaks with a higher spectral resolution. It means that with more photons per pixel peak intensities will be greater, giving peaks with an increased signal-to-noise ratio (SNR), defined as: SNR = Signal/Noise Where SNR = Signal = Noise = Signal-to-Noise Ratio Height of peak Baseline noise level near where the signal is measured Since...
Open the catalog to page 2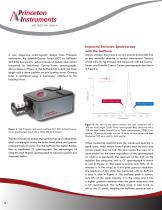
SPECTROSCOPY GROUP Improved Emission Spectroscopy with the IsoPlane A new dispersive spectrograph design from Princeton Instruments, the Schmidt-Czerny-Turner (SCT) or IsoPlane® SCT 320, has greatly reduced levels of optical aberrations compared to traditional Czerny-Turner spectrographs. Shown below in Figure 3, the IsoPlane has a 320 mm focal length and a three position on axis grating turret. Camera focus is optimized using a micrometer attached to the focusing mirror. Atomic emission lines have a narrow natural bandwidth and so are unusually sensitive to optical aberrations. Spectra of the...
Open the catalog to page 3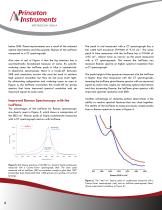
SPECTROSCOPY GROUP better SNR. These improvements are a result of the reduced optical aberrations and thus greater fluence of the IsoPlane compared to a CT spectrograph. Also note in red in Figure 4 that the Hg emission line is asymmetrically broadened because of coma. By greatly reducing coma the IsoPlane peak in blue is symmetrical. In dispersive spectroscopy there is a trade-off between SNR and resolution; narrow slits must be used to achieve high spectral resolution but they do not pass much light. By eliminating astigmatism and reducing coma as seen in Figure 4, the IsoPlane overcomes this...
Open the catalog to page 4
SPECTROSCOPY GROUP The peak denoted by the arrow in Figure 6 is the 1465 cm-1 Raman peak of cyclohexane. The spectrum in red was measured with a CT spectrograph. Note how this peak is barely resolved. The spectrum of the same peak measured with the IsoPlane is plotted in blue in Figure 6. In this spectrum the 1465 cm-1 peak is clearly visible. This is due to the IsoPlane’s better spectral resolution and is an example of how increasing resolution can increase the information content of a spectrum, allowing researchers to learn more from their data. Quality Data From All Portions of the Focal Plane...
Open the catalog to page 5All Princeton Instruments Acton catalogs and technical brochures
 Cosmos-Datasheet
16 Pages
 PI-MAX4
60 Pages


Archived catalogs
 PIXIS-XO Product Flyer
2 Pages
 PhotonMAX
2 Pages
 2D-OMA V Product Flyer
2 Pages
 PIXIS Product Flyer
2 Pages
- Digital imager
- Visible imager
- CMOS camera module
- Analysis software solution
- Infrared imager
- Monitoring camera system
- Full-color camera system
- Windows software
- Spectrometer
- GigE Vision camera
- HD camera module
- Temperature-controlled camera
- Camera with global shutter
- CCD video camera
- High-performance imager
- Laboratory spectrometer
- High-sensitivity video camera
- Spark optical emission camera module
- Megapixel imager
- Data acquisition software