Catalog excerpts

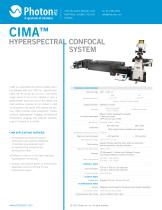
hyperspectral confocal system CIMA is a hyperspectral confocal system sensitive between 400 and 1700 nm. Spectral resolution can be as low as 0.2 nm in the visible range, and 0.6 nm in the infrared. It pairs a galvanometer head and one of the fastest and most sensitive cameras on the market to yield an acquisition rate above 300 spectra per second. CIMA provides three acquisition modes: confocal hyperspectral imaging, multispectral fluorescence imaging, and emission spectroscopy of a sample in a cuvette. TECHNICAL SPECIFICATIONS Spectral range » Simultaneously study the spatial distribution and spectral properties of complex nanomaterials such as upconverting nanoparticles and quantum dots. » Perform in vitro or in vivo high resolution hyperspectral microscopy. » Develop new sensors based on environment dependent spectral shifting of their fluorescence signal. Spectral resolution Custom resolution upon request Spatial resolution Cameras Excitation wavelength Microscope Objectives CIMA APPLICATIONS OVERVIEW: Wavelength absolute accuracy Maximum scanning speed Motorized XYZ stage Preprocessing Hyperspectral data format Software Power requirement Diffraction limited Back-illuminated CCD or EMCCD InGaAs linear array 980 nm (Other wavelengths available) 3 laser input ports UHP mercury lamp 130W Scientific grade, inverted 20X, 40X, 60X Other magnifications available upon request 0.25 nm > 300 spectra/s 120 x 75 x 0.15 mm Spatial filtering, statistical tools, spectrum extraction, data normalization, spectral calibration HDF5, FITS PC (Windows10 - 64-bits) with PHySpec™ control and analysis software (computer included) 120 VAC / 12A / 60Hz 230 VAC / 12A / 50Hz Confocal mode Scanning region Pinhole diameter Cuvette mode Cuvette size Fluorescence mode Camera Illumination lamp Epifluorescence filter cubes Megapixel colour camera for fluorescence and sample visualization UHP mercury lamp 130W Up to 6 different filter cubes
Open the catalog to page 1
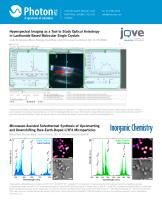
Hyperspectral of Visualized Experiments Journal Imaging as a Tool to Study Optical Anisotropy in Lanthanide-Based Molecular Single Crystals Emille M. Rodrigues, Nelson Rutajoga, David Rioux, Jacob Yvon-Leroux, Eva Hemmer. DOI: 10.3791/60826 Inorganic Chemistry Screenshot of Screenshot of the hyperspectral cube data ( lanthanide (Ln )-based the hyperspectral cube data analysis process. Diverse sp Figure 7: the PHySpec software showing thePHySpec software showing molecular single crystal) analysis process. Diverse spectral analysis methods can be applied on the acquired hyperspectral cube: 1...
Open the catalog to page 2All Photon etc. catalogs and technical brochures
-
ClaIR™
1 Pages
-
nCore For Mineral Knowledge
4 Pages
-
RIMA™
2 Pages
-
PHySpecTM
2 Pages
Archived catalogs
-
TLS - Tunable Laser Source
3 Pages
-
RIMA? BIOMED
2 Pages
-
The Hypercube
2 Pages
-
IMA FLUORESCENCE
2 Pages
-
RIMA RAMAN IMAGING SYSTEM
2 Pages
-
IMA PL
2 Pages
-
TUNABLE TOP NOTCH FILTER
2 Pages
-
Catalogue Photon etc
19 Pages


