- Catalogs
- PerkinElmer
- Monitoring Fast Chemical Reactions Application Note
- Products
- Catalogs
- News & Trends
- Exhibitions
Monitoring Fast Chemical Reactions Application Note
1 /3Pages

Monitoring Fast Chemical Reactions Application Note
1 /3Pages
Catalog excerpts

Molecular Spectroscopy Authors: Ian Robertson PerkinElmer, Inc. Seer Green, UK Ted King TgK Scientific Ltd. Bradford on Avon, UK Monitoring Fast Chemical Reactions using the Stopped-Flow Technique and the LAMBDA 465 Diode Array Spectrometer It is extremely important to understand what is occurring during chemical reactions and to be able to determine reaction completion, reaction rates under different conditions and also whether the reactions are single or multi-step. Spectrosopic techniques, such as UV-Visible spectrometry, can be deployed to observe the chemical changes taking place during reactions. However, in many cases the reaction timescales are too fast to be performed and observed by the simple manual mixing of the reactants in a cuvette. The stopped-flow technique is frequently used for rapid kinetics experiments allowing the reactants to mix effectively and react whilst monitoring the reaction in a low volume cuvette in the UV-Visible instrument. This application note demonstrates that the PerkinElmer LAMBDATM 465 Diode Array UV-Visible Spectrophotometer is perfectly matched to the TgK Scientific SFA-20 Rapid Kinetics Accessory allowing reaction monitoring on the millisecond timescale.
Open the catalog to page 1
The Stopped-Flow Technique Small volumes of solutions are rapidly driven from syringes into a high efficiency mixer to initiate a fast reaction. The resultant reaction volume then displaces the contents of an observation cell thus filling it with freshly mixed reagents. A schematic of the system is shown as Figure 1. “Traditional” stopped-flow UV-Visible analysis has required a priori knowledge of the reaction to enable single wavelengths to be selected for the reaction monitoring before performing the experiment. The LAMBDA 465 is a diode array instrument capable of collecting full range UV-Visible...
Open the catalog to page 2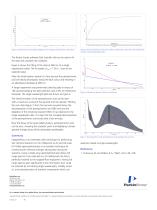
Figure 4. Reaction plots showing the disappearance of reagent and formation of product. Figure 5. Kinetic Studio fit for the data at 580 nm. Absorbance data (blue dots), fitted data (red line) and residual (green line). The Kinetic Studio software (TgK Scientific Ltd) can be used to fit the data and calculate rate constants. Figure 5 shows the fitting of the data at 580 nm to a single exponential model. The fit reveals a kobs = 1.56 s-1, close to the expected value. After the initial reaction period of a few seconds the peroxychromic acid will slowly decompose, losing the blue colour and resulting...
Open the catalog to page 3All PerkinElmer catalogs and technical brochures
 TGA 8000 Brochure
8 Pages
 Adulterant Screen Solutions
8 Pages
 AxION 2 TOF Brochure
8 Pages
 OilExpress Family Brochure
8 Pages
 Flexar SQ 300 MS Brochure
8 Pages
 AxION iQT GC/MS/MS
2 Pages
 Hyphenated Technology Guide
10 Pages
 Spectrum Two FT-IR Spectroscopy
12 Pages
 Clarus SQ8 GC/MS Brochure
12 Pages
 NexION 350 ICP-MS
12 Pages
 Onesource Overview Brochure
8 Pages
 XRpad 4336
2 Pages
 GC SNFR Olfactory Port
2 Pages
 AxION DSA Brochure
8 Pages


- SARRALLE gas analyzer
- SARRALLE management software
- SARRALLE automation software
- SARRALLE concentration analyzer
- SARRALLE cooler
- SARRALLE monitoring analyzer
- SARRALLE analysis software
- SARRALLE liquids analyzer
- SARRALLE process software
- SARRALLE automatic analyzer
- SARRALLE control software
- SARRALLE benchtop analyzer
- Liquid recirculation chiller
- SARRALLE industrial software
- SARRALLE portable analyzer
- Measurement software
- SARRALLE visualization software
- SARRALLE laboratory analyzer
- SARRALLE compact analyzer