- Catalogs
- Ophir Optronics
- Standard Photodiode Sensors
Standard Photodiode Sensors

Standard Photodiode Sensors
- Detector Type: Silicon with a 10x10mm aperture.
- Spectral Range: Varies by model, generally from 350-1100 nm.
- Power Range: From 500pW to 3W depending on the model and filter configuration.
- Accuracy: Varies with wavelength, with errors ranging from ±3% to ±10%.
- Damage Threshold: Up to 50 W/cm² for some models.
- Response Time: 0.2 seconds with meter.
Catalog excerpts
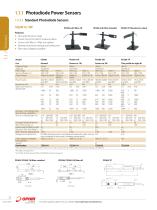
1.1.1 Photodiode Power Sensors 1.1.1.1 Standard Photodiode Sensors 50pW to 3W PD300 with filter installed Features ֺ ֺ Very large dynamic range ֺ ֺ Swivel mount for hard to measure places ֺ ֺ Comes with filter in / filter out options ֺ ֺ Patented automatic background subtraction ֺ ֺ Fiber optic adapters available Use Detector Type Aperture Filter mode Spectral Range nm Power Range General silicon 10x10mm Filter out Filter in 350-1100 430-1100 500pW to 30mW 200µW to 300mW 30mW to 30nW 300mW to and dBm 30mW and dBm 0.01 NA nm mW mW Powers to 1W silicon 10x10mm Filter out Filter in 350-1100 430-1100 500pW to 200µW to 1W 30mW 30mW to 30nW 1W to 30mW and dBm and dBm 0.01 NA nm mW mW Powers to 3W silicon 10x10mm Filter out Filter in 350-1100 430-1100 5nW to 100mW 200µW to 3W Thin profile for tight fit silicon 10x10mm Filter out Filter in 350-1100 400-1100 50pW to 3mW 20µW to 1W Power Scales Resolution nW Maximum Power vs. Wavelength Accuracy (including errors due to temp. variations) % error vs Wavelength nm ±10 360-400 NA ±10 360-400 NA ±3 400-950 ±5 430-950 ±3 400-950 ±5 430-950 ±5 950-1100 ±7 950-1100 ±5 950-1100 ±7 950-1100 Damage Threshold W/cm2 10 50 10 10 (a) Max Pulse Energy µJ 2 20 2 100 Noise Level for filter out pW 20 20 Response Time with Meter s 0.2 0.2 Beam Position Dependence ±2% ±2% Background Subtraction 95-98% of background is cancelled automatically under normal room conditions, even when changing continuously Fiber Adapters Available SMA, FC, ST, SC SMA, FC, ST, SC (see page 68 ) Version Part Number 7Z02410 7Z02411A Note: (a) Maximum power density above which sensor may not read correctly. There will be no permanent damage until 50W/cm² * For graphs see page 26-27 * For PD300-3W drawing see PD300-UV/PD300-IR drawing on page 23 PD300/ PD300-1W filter installed Front View Front View PD300 with filter installed PD300 with filter installed Front View Front View Front View PD300 with filter off PD300 with filter off For latest updates please visit our website: www.ophiropt.com/photon
Open the catalog to page 1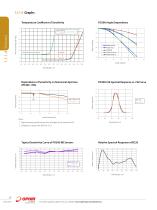
1.1.1.4 Graphs Temperature Coefficient of Sensitivity relative reading Percent change per degC Angle, degrees Dependence of Sensitivity on Numerical Aperture (PD300 - IRG) PD300-CIE Spectral Response vs. CIE Curve 1.2 relative responce relative sensitivity numerical aperture 1. Graph assumes equal intensity into all angles up to maximum N.A. 2. Calibration is done with SMF, N.A. 0.13 Relative Spectral Response of BC20 relative sensitivity, % relative responce, % Typical Sensitivity Curve of PD300-BB Sensors For latest updates please visit our website: www.ophiropt.com/photonics
Open the catalog to page 2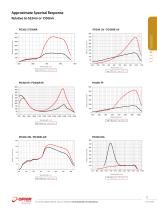
Approximate Spectral Response Relative to 633nm or 1550nm PD300 / PD300R Relative sensitivity Relative sensitivity Relative sensitivity Relative sensitivity 450 500 relative sensitivity Relative sensitivity Relative sensitivity Relative sensitivity wavelength nm Wavelength, nm filter out Filter out 700 600 Relative sensitivity Relative sensitivity Relative sensitivity Relative sensitivity 27 For latest updates please visit our website: www.ophiropt.com/photonics
Open the catalog to page 3All Ophir Optronics catalogs and technical brochures
 SP932U
1 Page
 ConoPoint-3
2 Pages
 nova catalog
2 Pages
 nova ii catalog
2 Pages
 vega catalog
2 Pages
 BeamWatchAM
2 Pages
 StarBright
2 Pages
 680274
1 Page
 L2000W-PF-120
1 Page
 L40(250)A-BB-50
1 Page
 IS1.5-VIS-FPD-800
1 Page
 Optimet Industrial Catalog 2017
34 Pages
 StarLite
2 Pages
 Power Meters Vega
2 Pages
 Goniometric Radiometers
3 Pages
 1780 Instantly measure M 2
2 Pages
 M200s
M200s3 Pages
 NanoScan 2s
14 Pages
 LBS-100 Attenuato
1 Page
 LBS-400 Beam Splitters
1 Page
 maging UV lasers
1 Page
 Near Field Profilers
1 Page
 BeamWatch®
5 Pages
 ModeCheck ®
3 Pages
 Nova
Nova2 Pages
 Calorimetric Power Meter
1 Page
 Power Pucks
1 Page
 Thermal Power Sensors
1 Page
 ompact Juno USB Interface
7 Pages
 StarBrigh
2 Pages
 YAG Focal Spot Analyzer
2 Pages
 PC Interfaces Juno
5 Pages
 Photodiode Energy Sensors
5 Pages
 Orion
Orion2 Pages
 Laserstar
2 Pages
 RP Sensors
2 Pages


Archived catalogs
 Laser Beam Profile Catalog
42 Pages
 Laser Beam Prifile catalog
42 Pages
 Complete Catalogue OPHIR
155 Pages
 Laser Beam Profile
42 Pages
 Laser Power Meters
4 Pages


- CMOS camera module
- Industrial camera module
- Infrared imager
- Automatic analyser
- Benchtop analyser
- USB camera module
- Portable analyzer
- GigE Vision camera
- Continuous analyzer
- Compact imager
- Compact analyzer
- Infrared analyser
- Calibration analyzer
- Camera with global shutter
- USB 3.0 camera module
- Distance sensor
- Medical video camera
- Power meter
- Camera objective
- 3D scanning system