
Catalog excerpts
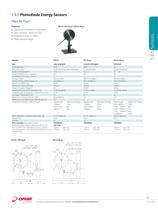
1.3.1 Photodiode Energy Sensors 10pJ to 15µJ PD10 / PD10-pJ / PD10-IR-pJ Model PD10 PD10-pJ PD10-IR-pJ Use Aperture mm Absorber Type Spectral Range µm (a) Surface Reflectivity % approx. Calibration Accuracy +/-% (a) Energy Scales Lowest Measurable Energy nJ Max Pulse Width ms Maximum Pulse Rate pps Noise on Lowest Range nJ Additional Error with Frequency % Linearity with Energy for > 10% of full scale Damage Threshold J/cm2 Maximum Average Power mW Maximum Average Power Density W/cm2 Maximum Energy vs. Wavelength Low energies φ10 Si photodiode with attenuator 0.19 - 1.1 50 5 20µJ to 20nJ 2 at 900nm 0.005 10kHz 0.2 ±1% to 10kHz ±1% 0.1 50 at 800nm 50 Wavelength Maximum Energy <300nm 15µJ 350-550nm 8µJ >800nm 5µJ Lowest energies φ10 Si photodiode 0.2 - 1.1 30 5 200nJ to 200pJ 0.01 at 900nm 0.005 10kHz 0.002 ±1% to 10kHz ±1% 0.1 0.5 5 Wavelength Maximum Energy <300nm 150nJ 350-550nm 75nJ >800nm 50nJ Fiber Adapters Available (see page 74) Weight kg Version Part number: Standard Sensor StarLink Sensor: Direct USB link to PC (p. 73) ST, FC, SMA, SC 0.25 V2 7Z02823 787150 ST, FC, SMA, SC 0.25 V2 7Z02824 Infrared φ5 Ge photodiode 0.7 - 1.8 30 5 20nJ to 200pJ 0.03 at 900nm 0.005 10kHz 0.010 ±1.5% to 10kHz ±1% 0.1 0.5 5 Wavelength 800 - 900nm 1000 - 1300nm 1300 - 1400nm 1480 - 1560nm >1650nm ST, FC, SMA, SC 0.25 Note: (a) This is basic calibration accuracy. In certain wavelength regions calibration there is additional error as tabulated here. <250nm >950nm <250nm >950nm 1.3.1 Sensors Features ֺ ֺ Silicon and Germanium detectors ֺ ֺ Very sensitive - down to 10pJ ֺ ֺ Repetition rates to 10kHz ֺ ֺ Wide spectral range PD10 / PD10-pJ add ±3% add ±2% add ±2% add ±2% Maximum Energy 20nJ 8nJ 7nJ 6nJ 20nJ 7Z02827 <900nm >1700nm add ±2% add ±2% PD10-IR-pJ 65 For latest updates please visit our website: www.ophiropt.com/photonics 01.01.2012
Open the catalog to page 1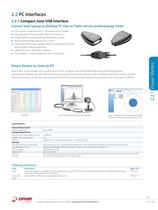
2.2 PC Interfaces 2.2.1 Compact Juno USB Interface Convert your laptop or desktop PC into an Ophir sensor power/energy meter ֺ ֺ ֺ ֺ From sensor to interface to PC - no power source needed Plug and play with all standard Ophir smart sensors Position & size measurement with BeamTrack sensors Record every energy pulse at up to 10 kHz Log power and energy, average, statistics, histograms and more with included StarLab application LabVIEW VIs and COM Object interface Very compact - is just an extension of the smart plug 2.2.1 Power Meters ֺ ֺ ֺ ֺ ֺ ֺ ֺ ֺ ֺ ֺ Smart Sensor to Juno to PC Ophir’s...
Open the catalog to page 2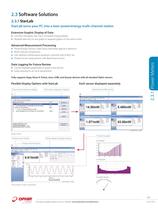
2.3 Software Solutions 2.3.1 StarLab StarLab turns your PC into a laser power/energy multi-channel station Extensive Graphic Display of Data ֺ ֺ ֺ ֺ Line Plot, Histogram, Bar chart, Simulated Analog Needle Multiple data sets on one graph or separate graphs on the same screen Advanced Measurement Processing Power/Energy Density, Scale Factor, Normalize against a reference Multi-channel comparisons User defined mathematical equations: channels A/B, (A-B)/C etc. Position & size measurement with BeamTrack sensors Data Logging for Future Review ֺ ֺ ֺ ֺ Can be displayed graphically or saved in...
Open the catalog to page 3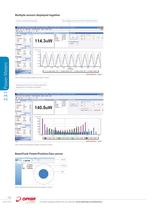
Multiple sensors displayed together The settings and scale are from channel chosen 2.3.1 Power Meters Click on one of the channels Here multi line graph display has been chosen Settings and functions may be opened to adjust then minimized as needed Here multi line histogram display has been chosen BeamTrack Power/Position/Size sensor Power Position Size Here a BeamTrack position and size graph is shown 102 01.01.2012 For latest updates please visit our website: www.ophiropt.com/photonics
Open the catalog to page 4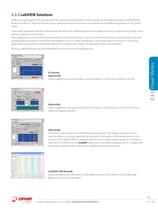
2.3.3 LabVIEW Solutions Ophir has long recognized the growing LabVIEW community of developers. For over 10 years, we have been providing LabVIEW libraries for all of our devices. These are full open-source applications that can be used as is or tailored by the LabVIEW programmer to his specific needs. These starter applications are basic software only that allows the LabVIEW programmer to experiment freely to fully feel the strength of our devices’ respective command sets. These applications contain VIs (Virtual Instruments) to control the instrument. You can combine VIs to create...
Open the catalog to page 5All Ophir Optronics catalogs and technical brochures
-
SP932U
1 Pages
-
ConoPoint-3
2 Pages
-
nova catalog
2 Pages
-
nova ii catalog
2 Pages
-
vega catalog
2 Pages
-
BeamWatchAM
2 Pages
-
StarBright
2 Pages
-
680274
1 Pages
-
P920 Beam Profiling Camera
1 Pages
-
L2000W-PF-120
1 Pages
-
L40(250)A-BB-50
1 Pages
-
IS1.5-VIS-FPD-800
1 Pages
-
Optimet Industrial Catalog 2017
34 Pages
-
Energy Sensors Accessories
1 Pages
-
StarLite
2 Pages
-
Power Meters & Interfaces
1 Pages
-
Power Meters Vega
2 Pages
-
Goniometric Radiometers
3 Pages
-
1780 Instantly measure M 2
2 Pages
-
M200s
3 Pages
-
NanoScan 2s
14 Pages
-
LBS-100 Attenuato
1 Pages
-
LBS-400 Beam Splitters
1 Pages
-
maging UV lasers
1 Pages
-
Near Field Profilers
1 Pages
-
BeamWatch®
5 Pages
-
ModeCheck ®
3 Pages
-
Nova
2 Pages
-
Calorimetric Power Meter
1 Pages
-
Power Pucks
1 Pages
-
High Power Thermal Sensors
1 Pages
-
Thermal Power Sensors
1 Pages
-
ompact Juno USB Interface
7 Pages
-
StarBrigh
2 Pages
-
Standard Photodiode Sensors
3 Pages
-
Medium Power BeamTrack-Power
1 Pages
-
Low Power BeamTrack-Power /
1 Pages
-
YAG Focal Spot Analyzer
2 Pages
-
Standard OEM Thermal Sensors
1 Pages
-
PC Interfaces Juno
5 Pages
-
Pyroelectric Energy Sensors
1 Pages
-
Orion
2 Pages
-
Laserstar
2 Pages
-
RP Sensors
2 Pages
-
Pyroelectric Energy Sensors
1 Pages
-
Special Photodiode Sensors
1 Pages
Archived catalogs
-
Laser Beam Profile Catalog
42 Pages
-
Laser Beam Prifile catalog
42 Pages
-
Complete Catalogue OPHIR
155 Pages
-
Laser Beam Profile
42 Pages
-
Laser Power Meters
4 Pages


