- Catalogs
- Ophir Optronics
- Laser Beam Prifile catalog
Laser Beam Prifile catalog

Laser Beam Prifile catalog
Spiricon has been a leader in laser beam profiling for over 28 years, offering systems for both pulsed and continuous wave (CW) lasers. Their products include silicon cameras, the Pyrocam pyroelectric camera, and various accessories, allowing measurements across a wide range of wavelengths and power levels. The systems conform to ISO 11146 standards and feature synchronization with pulsed lasers.
Spiricon offers two main software systems: Spiricon LBA for high accuracy and versatility, and BeamStar for ease of use and automated reporting. LBA includes features like Ultracal baseline correction, 2D and 3D viewing, and customizable apertures.
Specialized systems include the Pyrocam series for infrared profiling, the M2-2000 for ISO-compliant M2 measurements, and LPK beam profilers for industrial lasers. Accessories include UV conversion systems, beam expanders and reducers, filters, and the YAG Focal Spot Analyzer.
The LBA software offers Ultracal baseline correction, zoom capability, 2D and 3D views, and user-selectable Z-axis scaling. It supports multiple camera inputs and provides statistical analysis, pass/fail testing, and beam stability charts.
The software performs calculations such as total power or energy, peak power density, beam width, and divergence angle. It supports statistical analysis and pass/fail calculations.
Spiricon's Ultracal method enhances measurement accuracy by retaining fractional and negative numbers in the processed signal. The software supports multiple frame averaging and summing, convolution algorithms, and adjacent pixel averaging for improved signal-to-noise ratio.
Camera options include gamma correction and lens-applied options for image inversion and pixel scale adjustment.
Manual gain and black level control are available for specific applications. The system supports multiple synchronization and capture modes, including continuous capture, single shot, live video, and block mode. Interface options include ActiveX compatibility with MATLAB and LabVIEW.
The BeamStar software offers automated operation and easy report generation. It supports exclusive photodiode triggering and allows customization of digital camera formats for optimal resolution and speed.
The M²-200 Beam Propagation Analyzer measures beam focusability and helps tune lasers for optimal performance. It complies with ISO 11146 standards and offers both automatic and manual measurement modes.
This tool measures beam wavefronts, aiding in beam collimation and optical component inspection. It provides real-time wavefront data and supports both Zernike and Southwell reconstructor presentations.
These cameras are designed for scientific and industrial applications, covering a wide spectral range with features like a solid-state array camera and integrated chopper.
The Pyrocam III operates in IR and UV ranges, with interchangeable windows and a high dynamic range. It supports both chopped CW and pulsed operations.
These cameras offer a wide spectral range and high dynamic range, suitable for sophisticated measurements.
These cameras are USB 2.0 compatible and provide a spectral range of 350 - 1100nm.
These cameras offer a wide spectral range and feature selection, with high-speed electronic shutters.
The II-IV-CO2-BS Series provides an inline solution for monitoring and optimizing industrial CO2 laser beams.
These kits offer portable solutions for medium power lasers, including components like reflecting wedges and ND filters.
Includes UV image converters, attenuators, and beam splitters to manage laser beam intensity.
The document provides detailed specifications and descriptions of various optical and laser measurement products.
Several camera systems are described, each featuring a Hartmann array permanently mounted on the camera.
The document lists laser profiling kits for YAG and CO2 lasers, detailing the components included in each kit.
A variety of stackable filters and spacers are available, designed to adjust transmission levels and adapt camera mounts.
UV image converters are described, which convert UV images to visible images for CCD cameras.
The document details imaging systems, including beam expanders and reducers.
The WaveStar analyzer offers high-resolution spectral measurements with features like automatic peak detection.
This photodetector measures the temporal behavior of pulsed lasers, offering two modes of operation.
- Detector: Silicon photodiode
- Spectral Range: 0.19 - 1.1μm
- Detector Aperture: 4mm
- Performance Specifications:
- Gain: x1 gain and x250 gain
- Risetime: 6ns for x1 gain, 300ns for x250 gain
- Output Sensitivity (at 630nm): 20mV/mW into 50 ohm, 10V/mW into 1M ohm
- Noise Level: 10nW for x1 gain, 0.2μW for x250 gain
- Input Connections: Direct from laser or fiber optic cable
- Input Adapters: Accepts standard Ophir SMA and FC adapters and neutral density attenuators
- Attenuation: Accepts standard Ophir x10 and x50 ND attenuators, which can be stacked.
- Output Connection: BNC
- Power Supply Unit: Connected to head by telephone cable, runs on rechargeable batteries for 13 hours.
- Supplied Accessories: Rod and stand, 1-x50 attenuator, and 1-x10 attenuator
- Dimensions: Head dimensions are 46mm diameter x 90mm deep
- WaveStar-V: Instrument P/N 1Z02550, SMA fiber Adapter 1G01236, FC Fiber Adapter 1Z08229, LC Fiber Adapter 1Z08228, ST Fiber Adapter 1Z08226, SC Fiber Adapter 1Z08227
- WaveStar-U: Instrument P/N 1Z02551, same adapters as WaveStar-V
- FX 4X Beam Expander: Instrument P/N 1Z17009, Bracket P/N 1G01649, same adapters as WaveStar-V
- FPS-10: Instrument P/N 18024, same adapters as WaveStar-V
- Extra x10 Filter: Attenuation from x10 to x20, 400-1100nm, P/N 1Z08200
- Extra x50 Filter: Attenuation from x50 to x200, 450-1100nm, P/N 1Z08201
Catalog excerpts
88 88 For latest updates please visit our website: www.ophiropt.com / www.spiricon.com >
Open the catalog to page 1
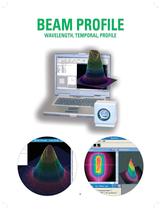
For over 28 years, Spiricon has been the leader in laser beam profiling. Spiricon systems provide all you need to profile both pulsed and CW lasers from W to Watts. Some 15 models of silicon cameras, along with our exclusive Pyrocam pyroelectric camera and various accessories allow measurements: From the deep UV to the far infrared From micrometer sized focal spots to large beams From very low powers up to kilowatts. Spiricon CCD beam profilers include hardware and software features designed to handle every measurement need. Conformance to ISO 11146 requirements is virtually assured > Ֆ after...
Open the catalog to page 2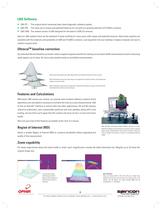
With LBA-FW, connecting multiple FireWire cameras is a snap. LBA-FW facilitates synchronizing the cameras in order to capture single events simultaneously from several locations. Allow the event to trigger the cameras, or setup a corresponding external trigger. Ultracal sets the baseline precisely. Beam width calculations become the most accurate.With the baseline set too low, laser wings are clipped off in the A/D converter. Calculated beam widths are now too small. With the baseline set too high, the algorithm interprets the baseline as wings in the laser beam. Calculated beam widths are now...
Open the catalog to page 3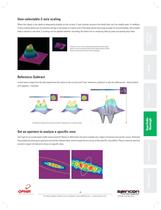
User-selectable Z-axis scaling > When the signal is too weak to adequately display on the screen, Z-axis scaling recovers the detail that cant be readily seen. In addition, Z-axis scaling allows you to examine energy in the wings of a beam even if the peak signal was large enough for normal display. Since beam data is stored in raw form, Z-scaling can be applied whether recording the beam live or analyzing data by post-processing days later. Viewed at 1x, the Z-axis provides little detail (left). At 8x the weak signal can now be examined easily (right). Without Ultracal, the DC baseline offset...
Open the catalog to page 4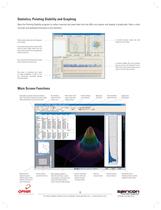
Peak location scatter plot with histogram color-coding. A pointing stability strip chart presents data over time for the Centroid X and Y, Peak X and Y and centroid radius from an origin or from the mean centroid.The radius is referenced from either an Origin established in LBA or from the continuously calculated Average Centroid position. A centroid location scatter plot with histogram color-codingAny notations entered here will be printed with the charts. Notes remain from one reset to the next and from one application startup to the next.Set a sample limit, and specify the results items to...
Open the catalog to page 5
Current frame հ and 90 respectably in 1 а incrementsMultiple display options: Second Moment (D4s) Օ Օ Along X-Y axis Current frame and reference frame overlay 90/10 Knife Edge Օ Along Major and Minor axis Current frame minus reference frame (Reference frame can be another beam profile or a Gaussian fit.) Knife Edge (User selectable level) Օ Օ Positions: Manually controlled, track centroid, track peakSecondary display of reference beam or Gaussian fit Crosshairs for precise point-to-point distance measurements Apertures Overlay aperture shows graphical representation of beam width calculation...
Open the catalog to page 6
Other Quantitative Measurement ChoicesTop Hat measurement of Mean, Standard Deviation (Choice of calculation method) (Per ISO 13694) Օ Shows graph of signal levels of all pixels.Divergence angle Separate X, Y or Major/Minor angles Օ Maximum and Minimum within user defined spatial limitsGaussian Fit calculations (Per ISO 13694) Intensity distribution histogram Near field and far field method (Use of lens, or two separated width measurements)Row and Column summing (Log Data only)EllipticalAnalysis of major/minor axis beam widths Orientation angle Օ Roundness factorAperturesDrawn aperture with user...
Open the catalog to page 7
Synchronization and Capture ModesMultiple options for camera triggering and synchronization CW - captures continuously at the camera frame rate Օ Trigger-In from laser Trigger-Out to laser Օ Video Trigger. Display and calculations update only when the camera captures a signal greater than a user set levelCapture options Continuous Օ Single shot Live Video (Displays at camera rate without calculations or storage of frames) Օ Block Mode (Captures frames at camera rate without display) Post processing (Processes a block of frames previously captured)Frame buffer to store frames limited only by computer...
Open the catalog to page 8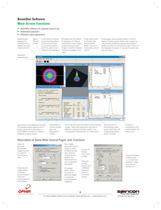
Profile graph shows profile chosen in the 2D display. Flexible system allows user to open as many profile screens as desired and choose X and/or Y profile or sum profile for each. Shown is the Gaussian fit screen. A top hat fit screen can also be shownStart/stop measurement Add button to add additional screens. This flexible system allows user to totally customize screen even to show different screens for different cameras on same screenAutomated or manual shutter, gain and background controlAll numerical values are shown in this compact screen. Note close agreement between 3 different measures...
Open the catalog to page 9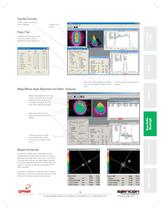
Choose which results you wish to displayAvailable for all functions with numerical results. Click on pass/fail and open dialog boxChoose X or Y profile Pass / Fail: values selected in dialog box will show green if pass and red if failTop Hat: Choose boundaries for analysisMeasure the distance from any point to any other point by right clicking on the mouse at the first point, moving to second point then right clicking again.Mark the position of the peak and centroid on the 2D display Display can be set to align automatically with major/ minor axes of image as well as XY. A region of interest...
Open the catalog to page 10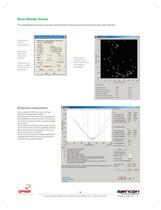
Choose timelimit for measurementSummary of data shown each period in log fileConcurrent with screen, log data to file in csv or text formatRecord data in microns or input distance from source and measure in microradians procedure has been thoroughly tested to give accurate results which are in most cases superior to automated M Ҳ measurement systems. software does the rest. Step by step it tells you what to do and when you have successfully completed all the measurements required by ISO, it informs you that the measurement is completed. This M > You can measure the M Ҳ of your laser with high...
Open the catalog to page 11All Ophir Optronics catalogs and technical brochures
 SP932U
1 Page
 ConoPoint-3
2 Pages
 nova catalog
2 Pages
 nova ii catalog
2 Pages
 vega catalog
2 Pages
 BeamWatchAM
2 Pages
 StarBright
2 Pages
 680274
1 Page
 L2000W-PF-120
1 Page
 L40(250)A-BB-50
1 Page
 IS1.5-VIS-FPD-800
1 Page
 Optimet Industrial Catalog 2017
34 Pages
 StarLite
2 Pages
 Power Meters Vega
2 Pages
 Goniometric Radiometers
3 Pages
 1780 Instantly measure M 2
2 Pages
 M200s
M200s3 Pages
 NanoScan 2s
14 Pages
 LBS-100 Attenuato
1 Page
 LBS-400 Beam Splitters
1 Page
 maging UV lasers
1 Page
 Near Field Profilers
1 Page
 BeamWatch®
5 Pages
 ModeCheck ®
3 Pages
 Nova
Nova2 Pages
 Calorimetric Power Meter
1 Page
 Power Pucks
1 Page
 Thermal Power Sensors
1 Page
 ompact Juno USB Interface
7 Pages
 StarBrigh
2 Pages
 Standard Photodiode Sensors
3 Pages
 YAG Focal Spot Analyzer
2 Pages
 PC Interfaces Juno
5 Pages
 Photodiode Energy Sensors
5 Pages
 Orion
Orion2 Pages
 Laserstar
2 Pages
 RP Sensors
2 Pages


Archived catalogs
 Laser Beam Profile Catalog
42 Pages
 Complete Catalogue OPHIR
155 Pages
 Laser Beam Profile
42 Pages
 Laser Power Meters
4 Pages


- CMOS camera module
- Industrial camera module
- Infrared imager
- Automatic analyser
- Benchtop analyser
- USB camera module
- Portable analyzer
- GigE Vision camera
- Compact imager
- Continuous analyzer
- Compact analyzer
- Infrared analyser
- Calibration analyzer
- Camera with global shutter
- USB 3.0 camera module
- Distance sensor
- Medical video camera
- Power meter
- Camera objective
- Ethernet video camera