
- Catalogs
- Onto Innovation Inc.
- See-through-silicon Inspection Application Studies Based on Traditional Silicon Imager

- Products
- Catalogs
- News & Trends
- Exhibitions
See-through-silicon Inspection Application Studies Based on Traditional Silicon Imager

See-through-silicon Inspection Application Studies Based on Traditional Silicon Imager
The document explores the advancements in semiconductor packaging technologies, emphasizing the transition from 2D to 3D integration to enhance transistor density. It highlights the importance of see-through-silicon inspection for quality control in 3D integrated circuits (3DIC) and chip-stacking industries, noting the preference for InGaAs detectors due to their spectral response despite higher costs and lower resolution compared to silicon-based detectors.
Silicon's band gap allows only low-energy photons beyond 1.2 microns to penetrate, making InGaAs detectors suitable for see-through applications. The study investigates the potential of silicon-based detectors in the 1-1.15 micron range, where photon penetration and detector sensitivity are low but usable.
Defect inspection relies on machine vision and human vision. Machine vision uses a golden image reference to detect defects, aiming to minimize false defect rates while maximizing capture rates. Human vision is used for defect review.
The study employs a CMOS-based silicon area camera and a DC Quartz Tungsten Halogen lamp for imaging. Initial observations reveal dark images with patterns obscured by a grayish background. Direct image subtraction is used to identify defects, though it results in many false positives.
Image contrast enhancement methods like normalization and equalization improve visibility but increase system noise, complicating machine vision inspection.
The study focuses on improving the signal-to-noise ratio (SNR) by targeting the sandwiched inner surface of wafers and using image subtraction to remove background noise. Summing multiple images enhances the useful signal and reduces system noise, improving defect visibility and contrast.
- Normalization/Equalization and Enhanced SNR Methods: These methods improve defect contrast for human review, though raw images are often inadequate due to weak signals.
- Machine Vision Inspection: Raw images can be used depending on defect size but are prone to false positives. Enhanced SNR methods are preferred for better defect contrast and noise reduction.
- Gray Scale Remapping Algorithms: These increase noise faster than enhancing defect contrast, making them unsuitable for machine vision.
Catalog excerpts
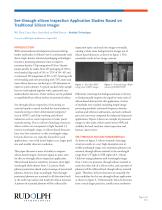
See-through-silicon Inspection Application Studies Based on Traditional Silicon Imager Wei Zhou, Darcy Hart, Noah Bock and Rolf Shervey - Rudolph Technologies Presented at SPIE Optics & Photonics, August 2011 With semiconductor development processes hitting harder and harder on Moore’s law to continuously scale down, high- density advanced packaging technologies become a promising alternate route to improve transistor density. Chip integration IO/cm2 density jumps quickly by orders from 2D packaging of 102 to wire bonded chip stack of 103, to TSV of 104~105 and to advanced 3D integration of 105 to 106. Starting with wire bonding and now prevailing with TSV, more and more silicon layers are stacked up in 3D dimension to improve system density. A typical stacked wafer sample has two wafers glued together with a patterned area sandwiched in between. Outer surfaces can be polished or unpolished bare silicon surface or patterned surface. See-through-silicon inspection is becoming an essential quality control method for semiconductor manufacturing in three-dimensional integrated circuit (3DIC) and chip-stacking and related industries such as crack inspection in solar panel manufacturing. Due to silicon’s band-gap structure, silicon wafers are transparent to light beyond 1.2 micron wavelength range, so silicon-based detectors have very low sensitivity to this wavelength range. InGaAs detectors are typically favored for such applications, even with much higher cost, larger pixel size and smaller detector resolution. This paper discusses a series of studies to improve silicon-based imagers’ detection signal-to-noise ratio for this see-through-silicon inspection application. Silicon-based detector sensitivity increases when light wavelength shifts shorter from 1.2 micron. Both photon penetration depth and percentage of penetrated photons, however, drop accordingly. Non-throughpenetrated photons are scattered in all directions both at the wafer top surface and inside the silicon material. A portion of scattered photons will be collected by inspection optics and reach the imager eventually, causing a white noise background in images out of silicon based detectors, as shown in figure 1. This essentially results in low image contrast. Figure 1 - Raw 8bit BMP image from CMOS imager Figure 2 - Processed image (Wafer courtesy of SEMATECH) Effectively removing this background noise is the key to fundamentally improve the signal-to-noise ratio of silicon-based detectors for this application. A series of methods were studied, including simple image processing methods, advanced frequency domain analysis and reference subtraction, and each method’s pros and cons were compared for industrial inspection applications. Figure 2 shows an example of processed images in this study, which carries better SNR and visibility for both machine vision inspection and human vision review. SEE-THROUGH-SILICON FUNDAMENTALS As shown in figure 3, silicon material’s band gap structure results in a very high absorption rate in visible wavelength range; very minimum photons can transmit through silicon material in the wavelength range from UV light to NIR region (0.3~1.0um). Only low-energy photons with wavelengths larger than 1.2um can penetrate through silicon material to reach the other side of a silicon wafer, and a portion of photons will be reflected back though silicon material again. Therefore, InGaAs detectors are naturally the best candidate for this see-through-silicon application, as shown in figure 4. Unfortunately, InGaAs detectors have a much larger pixel size, smaller array resolution
Open the catalog to page 1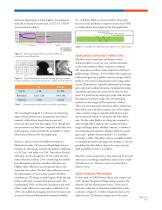
and most importantly a much higher cost compared with silicon based detectors such as CCD or CMOS (summarized in table 1). etc., will drive SNR to a lower number. This study focuses on the methods to improve system level SNR to enable silicon based detector for this application. Figure 5 - Example of visible spectral response on a silicon wafer Figure 3 - Silicon optical properties: spectral reflection, transmission and absorption Figure 4 - (left) Silicon/InGaAs based detector spectral response, (center) traditional silicon based detector, (right) InGaAs detector Table 1 - Summary of current...
Open the catalog to page 2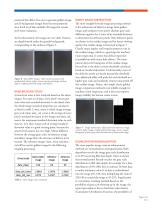
Table 2 - Raw images noise summary patterned but defect-free area to generate golden image, and 3) background images from the non-patterned area. Each set of data includes 20 images for system level noise evaluation. At first observation, the images are very dark. Patterns are deeply buried under the grayish background, corresponding to the analysis of figure 5. Figure 6 - Raw BMP images: (left) out of non-patterned sandwiched-silicon wafer; (center) patterned image without defects; (right) patterned image with defects BASELINE NOISE STUDY System level noise is first analyzed based on the above images....
Open the catalog to page 3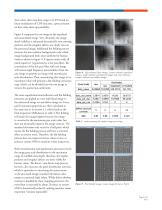
data value), then map data range to 0~255 based on linear modulation of CDF function, a process based on data value show up possibility. Figure 8 compares the raw image to the equalized and normalized image. Very obviously, the image detail visibility is enhanced dramatically, now missing patterns and the irregular defects are clearly seen on the processed image. Additional flat fielding process removes the non-uniform background so the whole image background looks more uniform for human vision as shown in figure 9. A square matrix with all pixels equal to 1 is generated as a low pass filter....
Open the catalog to page 4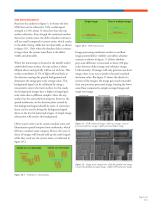
Based on the analysis in figure 5, in theory the best SNR that can be achieved is 7.6%: useful signal strength is 2.4%, about 13 times less than the top surface reflection. Even though the statistical number shows low system noise, the defect absolute contrast is still too small compared to system noise, which results in the defect being visible but not detectable, as shown in figure 10.1. Only when the absolute defect contrast is larger than the system noise floor, is the defect visible and detectable. When the microscope is focused at the double wafers’ sandwiched inner surface, the top surface...
Open the catalog to page 5All Onto Innovation Inc. catalogs and technical brochures
 Onto Innovation
19 Pages
 Solid State Technology
6 Pages
 Use style: paper title
6 Pages
 rudolph technologies
1 Page


- Management software solution
- Analysis software solution
- Process software
- Real-time software
- Windows software
- Computer-aided design software
- Design software solution
- Monitoring software solution
- Industrial software
- Inspection system
- Automatic tester
- Visualization software solution
- Industrial tester
- Automated software
- Thickness gauge
- Development software
- Reporting software
- Automatic inspection system
- Machine software
- Inspection machine