EWS-DE10 Energy Savings Analysis Software
1 /8Pages

EWS-DE10 Energy Savings Analysis Software
1 /8Pages
Catalog excerpts
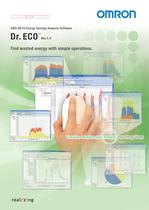
N E W EWS-DE10 Energy Savings Analysis Software Dr. ECO TM Ver.1.2 Find wasted energy with simple operations. Visualize, Monitor, and Analyze Your Energy Usage
Open the catalog to page 1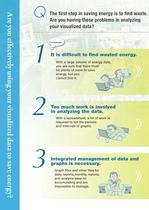
Are you effectively using your visualized data to save energy? The first step in saving energy is to find waste. Are you having these problems in analyzing your visualized data? 1 2 3 For example... It is difficult to find wasted energy. With a large volume of energy data, you are sure that there must be plenty of room to save energy, but you cannot find it. Too much work is involved in analyzing the data. With a spreadsheet, a lot of work is required to set the periods and intervals of graphs. Integrated management of data and graphs is necessary. Graph files and other files for daily reports,monthly...
Open the catalog to page 2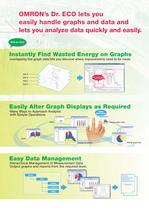
OMRON’s Dr. ECO lets you easily handle graphs and data and lets you analyze data quickly and easily. With Dr. ECO Instantly Find Wasted Energy on Graphs overlapping line graph data lets you discover where improvements need to be made. Data A Areas where energy can be saved Data B Data C Data D Easily Alter Graph Displays as Required Many Ways to Approach Analysis with Simple Operations Easy Operation Select. Change graph order. Zoom Change the period. Change graph type. Easy Data Management Hierarchical Management of Measurement Data Output graphs and reports from the required level. System Floor...
Open the catalog to page 3
Dr. ECO is a simple, easy-to-use It will help you reduce energy usage 1 Instantly Find Wasted Energy on Graphs A new feature lets you Comparison graphs. O l Overlapp Overlapping line graph Overlapping line graph lets you see where energy can be sa saved. Fluctuations in usage = Usage can be minimized. Standby power is always being used. Power not turned OFF over noon break. Before/After Displays You can immediately see changes in energy usage before and after energy-saving measures. Before After 8 9 10 11 12
Open the catalog to page 4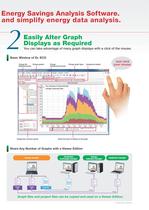
Energy Savings Analysis Software. and simplify energy data analysis. 2 Easily Alter Graph Displays as Required You can take advantage of many graph displays with a click of the mouse. Basic Window o Dr. ECO of Change the g Change graphs. displayed period. di l d i d Change measurement period. Change graph types. Comparison graphs. Just click your mouse. Tree structure to hierarchically manage measured data Select the items to display on the graph. Change the summary period. Share Any Number of Graphs with a Viewer Edition Production technology manager Energy manager Project file Project file...
Open the catalog to page 5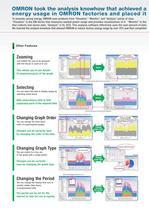
OMRON took the analysis knowhow that achieved a energy usage in OMRON factories and placed it To promote saving energy, OMRON sees products from “Visualize,” “Monitor,” and “Analyze” points of view. “Visualize” is the KM Series that measures wasted power usage and provides visualizations of it. “Monitor” is the that collects and stores data. “Analyze” is Dr. ECO. This analysis software effectively uses the vast amount of data We inserted the analysis knowhow that allowed OMRON to reduce factory energy usage by over 10% and then completed Other Features Zooming Consumption changed temporarily....
Open the catalog to page 6
EW700 Series that finds changes in energy usage and collected by hardware to analyze and find wasted energy. the software by making is easy to use by essentially anyone. Easy Data Management Manage expanding volumes of energy data in With a single database you can analyze according to different levels in the hierarchy and link to a system diagram. System Diagram Power intake system diagram. '■■■Pi B-1 floor outlets CD Compare on superimposed graphs. Easier Preparation Of Reports You can convert graphs directly to CSV files according to the measurement period. Daily data output . Weekly data Monthly...
Open the catalog to page 7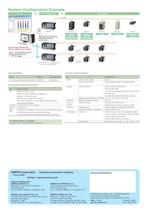
System Configuration Example + Dr. ECO Data collection device + Energy sensors RS-485 EW700 SD card Measurement data can be collected in SD cards or via a LAN. KM50-E Power KM50-C Power KM20-B40 Power KM100 Power Flow rate Flow rate Workpiece supply K3GN Temperature Workpiece supply Pressure LAN Easy EW-Logger Automatic Data Collection Software is also included. KM50-C The DVD-ROM includes Dr. ECO and the Easy EW-Logger. KM50-C Data can also be collected from more than one EW700. Standard Models Functions and Specifications Name Model Standard price Item Dr. ECO Energy Savings Analysis Software...
Open the catalog to page 8All OMRON catalogs and technical brochures
 D4F
D4F8 Pages
 D4GS-N
11 Pages
 E4E2
E4E25 Pages
 Fiber SensorBest Selection Catalog
104 Pages
 Fiber Unit E32-LT/LD
4 Pages
 G9SE Series
20 Pages
 NX-SL/SI/SO
20 Pages
 G9SP
G9SP28 Pages
 G9SX-SM
24 Pages
 G9SX-SM/LM
9 Pages
 G9SX/G9SX-GS
49 Pages
 G9SX-LM
28 Pages
 G9SB
G9SB10 Pages
 G9SA
G9SA16 Pages
 DST1 Series
5 Pages
 WS02-CFSC1-E
3 Pages
 G9SA-300-SC
9 Pages
 K8AK-AS
12 Pages
 K8AK-AW
16 Pages
 K8AK-VS
12 Pages
 K8AK-VW
12 Pages
 K8AK-PH
12 Pages
 K8DS-PH
12 Pages
 K8AK-PM
16 Pages
 K8DS-PM
12 Pages
 K8AK-PA
12 Pages
 K8DS-PA
12 Pages
 K8AK-PW
12 Pages
 K8DS-PU
12 Pages
 K8DS-PZ
12 Pages
 K8AK-TS/PT
12 Pages
 K8AK-LS
12 Pages
 K8AK-TH
12 Pages
 K2CM
K2CM16 Pages
 SE
SE15 Pages
 SAO
SAO13 Pages
 APR-S
APR-S6 Pages
 XS5
XS525 Pages
 XS2
XS229 Pages
 F92A
F92A4 Pages
 GLS
GLS3 Pages
 TL-L
TL-L5 Pages
 V680 series
68 Pages
 V680S Series
68 Pages
 MY
MY35 Pages
 E3NC-L/-S
16 Pages
 61F-GPN-BT / -BC
5 Pages
 NE1A-SCPU Series
8 Pages
![NE1A-SCPU0[]-EIP](https://img.directindustry.com/pdf/repository_di/15954/ne1a-scpu0-eip-616667_1mg.jpg) NE1A-SCPU0[]-EIP
NE1A-SCPU0[]-EIP8 Pages
 NE0A-SCPU01
6 Pages
 LY
LY14 Pages
![G2R-[]-S](https://img.directindustry.com/pdf/repository_di/15954/g2r-s-616653_1mg.jpg) G2R-[]-S
G2R-[]-S11 Pages
 G7T
G7T7 Pages
 G2A
G2A9 Pages
 G2A-434
7 Pages
 G2AK
G2AK7 Pages
 MK-S
MK-S9 Pages
 MK-S(X)
12 Pages
 MM
MM17 Pages
 MMK
MMK14 Pages
 G4Q
G4Q6 Pages
 G7Z
G7Z9 Pages
 G7J
G7J10 Pages
 E4B
E4B12 Pages
 E4A-3K
9 Pages
 E4C-UDA
5 Pages
 E6H-C
E6H-C5 Pages
 E6F-C
E6F-C5 Pages
 E6D-C
E6D-C5 Pages
 E6B2-C
5 Pages
 E6A2-C
5 Pages
 NL
NL8 Pages
 VB
VB5 Pages
 SC
SC5 Pages
 D5F
D5F5 Pages
 D5A
D5A8 Pages
 E3S-GS3E4
3 Pages
 E3S-R
E3S-R11 Pages
 E3S-A
E3S-A21 Pages
 E3S-CL
9 Pages
 E3ZM-C
14 Pages
 E3T Data Sheet
26 Pages
 E3T Series
6 Pages
 G5 Series
59 Pages
 Sysmac Catalog
410 Pages
 VT-X700
6 Pages
 E5AC-T
8 Pages
 CP1
CP112 Pages
 CP1E
CP1E12 Pages
 MS4800
40 Pages
 VC-DL100
6 Pages
 FZ4 Series
42 Pages
 ZG2
ZG216 Pages
 ZS Series
32 Pages
 ZW Series
24 Pages
 E9NC-T
2 Pages
 Vision System FH series
54 Pages
 CompoNet
28 Pages
 F3SJ Series Safety Light Curtain
108 Pages
 Code Reader/OCR
24 Pages
 Fiber Sensor Best Selection Catalog
100 Pages
 Portable Multi-logger ZR-RX70
12 Pages
 Air Particle Sensor ZN-PD-S
2 Pages
 NT series
18 Pages
 Round Water-resistant Connectors
31 Pages
 Safety Controller G9SP
28 Pages
 E3FA PHOTOELECTRIC SENSORS
24 Pages
 Switch Mode Power Supply S8VK-G
22 Pages
 Data Logger ZR-RX Series
12 Pages
 Programmable Terminals NS Series
57 Pages
 DeviceNet Safety System
30 Pages
 Switching Power Supplies
16 Pages
 Photomicro Sensors
7 Pages
 Displacement Sensors
4 Pages
 R87F / R87T AC Axial Fans
28 Pages
 H8PS Cam Positioner
32 Pages
 OS32C Safety Laser Scanner
24 Pages
 FQ Vision Sensor
17 Pages
 ZN-PD Air Particle Sensor
16 Pages
 S8EX Switch Mode Power Supply
24 Pages
 CP1L CP series CP1L CPU Unit
36 Pages
 E2EF
E2EF8 Pages
 FQ2 Smart camera
24 Pages


Archived catalogs
 REGULATION SOLUTIONS
24 Pages
 Sensor Accessories
38 Pages
 SMART REMOTE I/O
12 Pages
 SAFETY APPLICATION HANDBOOK
55 Pages
 Vision Systems
20 Pages
- SARRALLE industrial robot
- Digital I/O
- Single-pole switch
- IO module
- Propeller fan
- Push-button switch
- SARRALLE air circulation fan
- Digital temperature control
- SARRALLE industrial fan
- Terminal box
- Switching relay
- Analog I/O
- SARRALLE digital indicator
- Digital IO module
- SARRALLE handling robot
- SARRALLE 3D software
- AC fan
- SARRALLE interface software
- SARRALLE panel-mount indicator
- SARRALLE simulation software