- Catalogs
- NETZSCH Analyzing & Testing
- Thermoreflectance by Pulsed Light Heating NanoTR/PicoTR
- Company
- Products
- Catalogs
- News & Trends
- Exhibitions
Thermoreflectance by Pulsed Light Heating NanoTR/PicoTR
1 /9Pages

Thermoreflectance by Pulsed Light Heating NanoTR/PicoTR
1 /9Pages
Catalog excerpts

Thermoreflectance by Pulsed Light Heating NanoTR/PicoTR Thermophysical Analysis of Thin Films: Thermal Diffusivity, Thermal Effusivity, Thermal Conductivity and Interfacial Thermal Resistance Analyzing & Testing
Open the catalog to page 1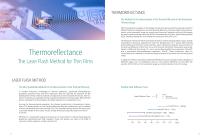
THERMOREFLECTANCE The Method for the Determination of the Thermal Diffusivity in the Nanometer Thickess Range With the significant progress in the design of electronic devices and the associated need for efficient thermal management, accurate thermal diffusivity / thermal conductivity measurements in the nanometer range are crucial more than ever. Materials with such thicknesses are used in phase-change memories (PCM), thermoelectric thin films, light emitting diodes (LED), interlayer dielectrics, and transparent conductive films (FPD), etc. The National Institute of Advanced Industrial Science...
Open the catalog to page 2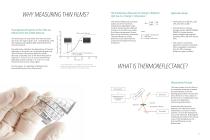
WHY MEASURING THIN FILMS? Thermophysical Properties of Thin Films are Different from that of Bulk Materials The plot below indicates the dependency of thermal diffusivity on the grain size. At decreasing grain size (film thickness), the thermal diffusivity values decrease, especially close to the mean free path of electrons (~1.5×10⁻⁵ m2/s at 15 nm). The thermal diffusivity of bulk material is ~5.4×10⁻⁵ m2/s and therefore three to four times higher. For this reason, it is essential to determine the thermal diffusivity of thin films as well. The thicknesses of nanometer-thin films are often less...
Open the catalog to page 3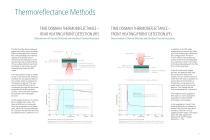
Thermoreflectance Methods TIME DOMAIN THERMOREFLECTANCE – REAR HEATING/FRONT DETECTION (RF) Determination of Thermal Diffusivity and Interfacial Thermal Resistance The fact that the thermophysical properties of thin layers and films differ considerably from those of the corresponding bulk material requires a technique which overcomes the limitations of the classical laser flash method (LFA). This so-called ultrafast laser flash technique is also known as rear heating/front detection (RF) mode. The measurement setup is similar to the conventional LFA: detector and laser are on opposite sides of...
Open the catalog to page 4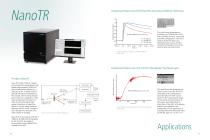
Temperature History Curve of TiN Thin Films Consisting of Different Thicknesses 200 nm Amplitude (normalized) Amplitude (normalized) Amplitude (normalized) Amplitude (normalized) This plot shows temperature nm films, 200-, excursions of TiN200thin 400- and 600-nm thick, measured in the RF configuration. The front surface of the thin films was heated by laser pulses, and the resultant temperature rise of the ∙10-6 m /s back surface was monitored. Temperature History Curve of an OEL Thin Film Between Two Metal Layers Al Al NanoTR is in accordance with JIS R 1689, JIS R 1690, and SI traceable by...
Open the catalog to page 5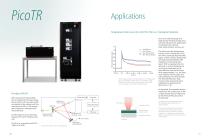
Applications Temperature History Curve of a ZnO Thin Film on a Transparent Substrate Due to its wide band gap and large exciton-binding energy, ZnO has been attractive for applications in optoelectronic devices, ultra-violet emitters, sensors, etc. Thermoreflectance signal PicoTR measurements on ZnO samples in FF configuration (see picture below): 100 nm Mo on ZnO 420 nm (red); 100 nm Mo on ZnO 130 nm (light green); 100 nm Mo on ZrO2 (purple); 100 nm Mo on quartz (blue) As expected, this example demonstrates that the cooling rate of the surface temperature is influenced by the thermal effusivity...
Open the catalog to page 6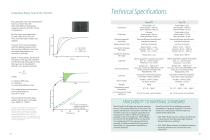
Technical Specifications Temperature History Curve of SiO2 Thin Films Mo thin layers were deposited on both sides of the SiO2 thin films, and triple layer analysis was applied. For each of the curves obtained with the different layers of SiO2, the areal heat diffusion time* was calculated and plotted as α function of thickness. Based on these results, the thermal resistance of the SiO2/Mo interface and the thermal diffusivity (α) of the SiO2 layer can be calculated to 8.8×10⁻⁷ m2/s using the formula: Thermorelectance signal/a.u. Thermorelectance signal/a.u. Thermorelectance signal/a.u. The upper...
Open the catalog to page 7
OBTAINING RESULTS IN SECONDS IN-SITU DISPLAY AND ANALYZING Rear heating/front detection (RF mode) The thermal diffusivity is measured cross sectionally using RF configuration. The obtained temperature rise curves fit with the theoretical equation to determine heat diffusion times (Mirror image method). The state-of-the-art measurement/analysis software of NanoTR/PicoTR has an easy-to-handle user interface which allows for precise determination of the thermal properties of thin films. Focusing of the laser beam can be adjusted by the software and a CCD picture can be obtained. NanoTR/PicoTR software...
Open the catalog to page 8
The NETZSCH Group is an owner-managed, international technology company with headquarters in Germany. The Business Units Analyzing & Testing, Grinding & Dispersing and Pumps & Systems represent customized solutions at the highest level. A worldwide sales and service network ensure customer proximity and competent service. Our performance standards are high. We promise our customers Proven Excellence – exceptional performance in everything we do, proven time and again since 1873. NETZSCH-Gerätebau GmbH Wittelsbacherstraße 42 95100 Selb, Germany Tel.: +49 9287 881-0 Fax: +49 9287 881-505 [email protected]...
Open the catalog to page 9All NETZSCH Analyzing & Testing catalogs and technical brochures
 TG 309 Libra Series
24 Pages
 Kinexus Prime Series
20 Pages
 NTA Fire Testing Systems
20 Pages
 Advanced Materials Testing
32 Pages
 DIL 502 Expedis Series
28 Pages
 NETZSCH Energy Solutions
40 Pages
 Product Overview
12 Pages
 HFM 706 Lambda Series
16 Pages
 TMA 512 Hyperion® Series
24 Pages
 LFA 427 - product brochure
24 Pages
 Kinexus Prime DSR Series
20 Pages
 LFA 717 HyperFlash® Series
28 Pages
 DMA 303 Eplexor
24 Pages
 DSC 300 Caliris Series
28 Pages
 STA 509 Jupiter Series
28 Pages
 DEA 288 Ionic
20 Pages
 STA 2500 Regulus
12 Pages
 NTA Guarded Hot Plate Series
16 Pages
 Rosand Series
20 Pages
 Accelerating Rate Calorimetry
20 Pages
 NTA HotBoxes
16 Pages
 DIL 402 Expedis Classic
16 Pages
 Kinetics NEO
20 Pages
 TG-FTIR - product brochure
24 Pages
 TA-QMS Coupling
28 Pages
 HMOR 422
1 Page
 RUL/CIC 421
1 Page
 Cone Calorimeter TCC 918
12 Pages
 SBA 458 Nemesis®
24 Pages
 NETZSCH NEVIO Instrument Series
24 Pages
 Thermal Insulation Materials
24 Pages
 DMA GABO EPLEXOR up to 1500°C
12 Pages
 GABOMETER®
8 Pages


- Test machine
- NETZSCH measuring instrument
- NETZSCH gas analyzer
- NETZSCH test chamber
- Concentration analyzer
- Monitoring analyzer
- Liquids analyzer
- Test stand
- Windows software
- NETZSCH automatic analyzer
- Temperature test chamber
- Material test machine
- Automated testing machine
- Climatic test cabinet
- NETZSCH benchtop analyzer
- NETZSCH solids analyzer
- Spectrometer
- Quality control test cell
- Computer-controlled test machine