 Website:
NETZSCH Analyzing & Testing
Group: NETZSCH
Catalog excerpts

Investigation of Pharmaceuticals, Foods and Cosmetics with the NETZSCH Nevio Instrument Series Analyzing & Testing
Open the catalog to page 1
and , TGA d DSC ents en High- equipm STA THERMAL ANALYSIS Essential for Every Laboratory ... Thermal Analysis is a set of techniques which have been used in countless laboratories around the globe to analyze and characterize organic and inorganic substances − whether solid or liquid. Classical Thermal Analysis assesses changes in material properties during heating or cooling with regard to mass loss, dimensional changes or phase transitions. The methods most frequently applied are: Differential scanning calorimetry (DSC) Thermogravimetric analysis (TGA) Simultaneous thermal analysis (STA,...
Open the catalog to page 2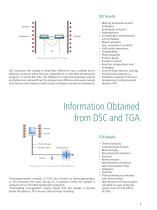
DSC measures the change in heat-flow difference into a sample and a reference material while they are subjected to a controlled temperature program. In a heat-flux DSC, the difference in heat flow between sample and reference is derived from the temperature difference between sample and furnace and reference and furnace or between sample and reference. Melting temperatures and enthalpies (enthalpies of fusion) Polymorphism Crystallization temperatures and enthalpies Glass transitions (e.g., amorphous content) Solid-solid interactions Compatibility Phase diagrams Eutectic purity Solid-fat...
Open the catalog to page 3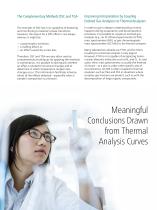
Improving Interpretation by Coupling Evolved Gas Analyzers to Thermal Analyzers The strength of DSC lies in its capability of detecting and monitoring a material’s phase transitions. However, the reason for a DSC effect is not always obvious; it might be: In order to gain a deeper understanding of what happens during evaporation and decomposition processes, it is possible to couple an evolved gas analyzer (e.g., an FT-infrared spectrometer (FT-IR), mass spectrometer (MS), or gas chromatographmass spectrometer (GC-MS)) to the thermal analyzer. a polymorphic transition, a melting effect, or...
Open the catalog to page 4
Substance: Mol mass: Purity: Impurities: Area: 158.7 J/g T melting: Peak*: 159.6°C T meting pure: Onset: 156.7°C Correction for linearization: Baseline: Area: 166.1 J/g Peak*: 171.6°C [1.2] Onset: 169.0°C Van‘t Hoff Lin. Van‘t Hoff 160 180 DSC measurement on paracetamol (4-acetaminophenol); sample mass: 2.6 mg, Al crucibles with pierced lid, heating rate: 10 K/min, nitrogen atmosphere Upon application of a heatingcooling cycle, this sample exhibits just one DSC peak within the 1st heating (green). The extrapolated onset temperature at 169°C correlates well to the melting point of the...
Open the catalog to page 5
Maintaining the Feel and Spreadability of a Lip Balm over a Broad Temperature Range Lip balms usually consist of various waxes or fats plus cosmetic additives which care for the lips. Shown here is the melting behavior of a commercial lip balm between -20°C and 85°C, recorded by DSC. Altogether, five superimposed peaks can be seen. The melting progression is reflected by the integral curve (red). At 25°C, 47% of the mixture is already molten (liquid portion) and 53% (= 100% minus 47%) is still solid. Therefore, the amount of the “solid-fat content” in the present case is 53% at 25°C, 45% at...
Open the catalog to page 6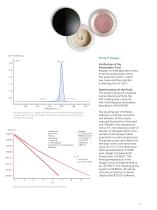
Verification of the Polymorphic Form Nipagin, or methylparaben, exists in various polymorphic forms. The monoclinic form I, which was measured here, exhibits a melting point at 126°C. Determination of the Purity The eutectic purity of a material can be determined from the DSC melting peak using the Van’t Hoff equation (procedure described in ASTM E928). DSC measurement on nipagin (chemical name: methyl 4-hydroxybenzoate); sample mass: 2.12 mg, Al crucibles with pierced lid, heating rate: 0.7 K/min, nitrogen atmosphere Substance: Mol mass: Purity: Mid: 85.0°C Impurities: Delta Cp*: 0.152...
Open the catalog to page 7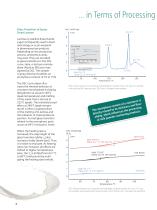
Glass Transition of SprayDried Lactose Lactose (crystalline disaccharide sugar) is frequently used in food technology or as an excipient in pharmaceutical products. Depending on the production process, amorphous areas may exist. They are recorded as glass transitions in the DSC curve. Here, α-lactose monohydrate (FlowLac 90) was investigated by DSC. The sample is spray-dried and exhibits an amorphous content of 10 to 15%. The DSC curve above illustrates the thermal behavior of α-lactose monohydrate including dehydration at around 149°C (peak temperature) and melting of the water-free...
Open the catalog to page 8
-2 DSC measurement on potassium clavulanate; sample mass: 2.3 mg, Al crucibles 200.2°C -3 Hygroscopicity: A Challenge for Shelf Life Potassium clavulanate is classified as hygroscopic. Therefore, the condition of the supplied material is crucial to its shelf life. Here, DSC and TGA-FT-IR measurements were carried out to elucidate the condition of this chemical. DSC Measurement During heating in nitrogen atmosphere, the DSC curve (upper plot) shows two effects: a stretched endothermal one with a peak temperature at 77°C and a double exothermal peak starting at 187°C (extrapolated onset)....
Open the catalog to page 9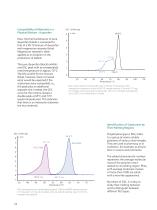
Area: 166.1 J/g Peak*: 171.6°C Onset: 169.0°C Compatibility of Materials in a Physical Mixture – Ibuprofen 100 Here, the thermal behaviorTemperature /°C of pure The pure ibuprofen (black) exhibits one DSC peak77.3°C an extrapolated with onset temperature of approx. 76°C. The DSC profile for the mixture (blue), however, does not reveal what would be expected if the substances were compatible; i.e., -1.87 % this peak plus an additional separate one. Instead, the DSC curve for the mixture reveals a double peak at 65°C and 73°C (peak temperatures). This indicates that there is an interaction...
Open the catalog to page 10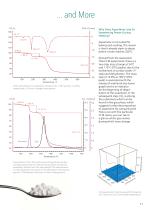
TGA measurement on aspartame; sample mass: 7.46 mg, Al2O3 crucible, heating rate: 10 K/min, nitrogen atmosphere Presentation of the TGA (red) curve of aspartame and the corresponding traces of methanol and carbon dioxide (as examples), derived from the associated FT-IR measurement. TG /% A trace represents the course of the absorption intensity of a specific FT-IR band as a function of time or temperature. Derived from the associated TGA-FT-IR experiment, there is a two-step mass change at 54°C and 115°C (DTG peaks), due to the evolvement of surface water (1st step) and dehydration. The...
Open the catalog to page 11All NETZSCH Analyzing & Testing catalogs and technical brochures
-
DMA 303 Eplexor
24 Pages
-
LFA 717 HyperFlash® Series
28 Pages
-
DSC 300 Caliris Series
28 Pages
-
STA 509 Jupiter Series
28 Pages
-
TG 309 Libra Series
24 Pages
-
DEA 288 Ionic
20 Pages
-
STA 2500 Regulus
12 Pages
-
NTA Guarded Hot Plate Series
16 Pages
-
TMA 402 F1/F3 Hyperion®
16 Pages
-
Rosand Series
20 Pages
-
Accelerating Rate Calorimetry
20 Pages
-
NTA HotBoxes
16 Pages
-
DIL 402 Expedis Select/Supreme
28 Pages
-
DIL 402 Expedis Classic
16 Pages
-
Product Overview
12 Pages
-
NETZSCH Energy Solutions
40 Pages
-
Advanced Materials Testing
32 Pages
-
NTA Fire Testing Systems
20 Pages
-
Kinetics NEO
20 Pages
-
TG-FTIR - product brochure
24 Pages
-
TA-QMS Coupling
28 Pages
-
Kinexus Prime DSR Series
20 Pages
-
Kinexus Prime Series
20 Pages
-
HMOR 422
1 Pages
-
RUL/CIC 421
1 Pages
-
Cone Calorimeter TCC 918
12 Pages
-
Thermal Insulation Materials
24 Pages
-
SBA 458 Nemesis®
24 Pages
-
NETZSCH NEVIO Instrument Series
24 Pages
-
LFA 427 - product brochure
24 Pages
-
DMA GABO EPLEXOR up to 1500°C
12 Pages
-
GABOMETER®
8 Pages


