
Catalog excerpts

Linearity Studies Introduction The linear response of absorbance with increasing concentration for the Thermo Scientific NanoDrop™ 8000 Spectrophotometer was evaluated in two separate studies. Both nucleic acid samples and protein samples were measured on a NanoDrop 8000 and compared to the same samples measured on an Agilent 8463 Spectrophotometer fitted with a 2 mm pathlength quartz microcuvette and a 0.2 mm Implen cell. Expected Concentration Method-dsDNA A stock solution of ~ 3600 ng/ul of dsDNA was prepared from powdered fish sperm DNA using HPLC Grade H2O (pH 7). Serial dilutions of the stock solution were prepared and the absorbance of each was measured on the Agilent 8453 spectrophotometer and the NanoDrop 8000 spectrophotometer using HPLC grade H2O as the “blank” reference solution. DNA concentrations (ng/ul) for the Agilent 8543 were calculated by first multiplying the respective A260 nm value by 5, and then applying Beer’s Law. This dilution factor is required to account for the 2 mm path. The Implen 0.2 mm cuvette was used for samples with concentrations known to be above 600 ng/ul or 1.5 absorbance units. Concentration calculations were obtained by multiplying the respective A260 nm value by 50 to normalize to 10 mm, then applying Beers Law. The average dsDNA concentration values obtained from the NanoDrop 8000 and the Agilent 8453 are listed in Table 1 below. All data shown for the NanoDrop 8000 Spectrophotometer was automatically normalized to a 10 mm pathlength and a Grand Mean (the average of all replicates for all channels) was used. Thermo Fisher Scientific - NanoDrop products Linearity Comparison: NanoDrop 8000 vs Agilent 8453 4000 3000 dsDNA (ng/ul) The absorbance values for DNA were measured on both systems at 260 nm with bichromatic normalization at 340 nm. For the NanoDrop 8000, replicates were simultaneously applied to each of the eight pedestals using an 8 channel micro volume pipette (Biohit M10). The NanoDrop operating software automatically determines the nucleic acid concentration using Beer’s Law and the mass extinction coefficient of 50 ng/ul cm –1 for dsDNA. Expected concentration dsDNA (ng/ul) With the NanoDrop 8000 spectrophotometer’s automatic path length selection, the linear response was measured across the full range of samples using a single method configuration. By contrast, two individual cells were necessary for the Agilent 8453 Spectrophotometer to obtain the equivalent range of quantitation. Technical support: info@nanodrop.com
Open the catalog to page 1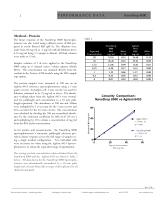
Method- Protein The linear response of the NanoDrop 8000 Spectrophotometer was also tested using a dilution series of BSA prepared in sterile filtered PBS (pH 8). The dilutions were made from 50 mg/ml to .5 mg/ml with all dilutions above 6.25 mg/ml being 1:2 sample to diluent. All final volumes were made to 15 mL. Expected Concentration Samples volumes of 2 ul were applied to the NanoDrop 8000 using an 8 channel micro volume pipette (Biohit M10). The concentration was obtained directly from the readout in the Protein A280 module using the BSA sample type option. As for nucleic acid...
Open the catalog to page 2All NanoDrop catalogs and technical brochures
-
 NanoDrop Product Family
16 Pages
-
 NanoDrop One/One c
8 Pages


