


- Company
- Products
- Catalogs
- News & Trends
- Exhibitions
AMP 2019 Article

AMP 2019 Article
Introduction
The document explores advancements in software algorithms and design for automating microstructure image analysis, focusing on replacing traditional Electron Backscatter Diffraction (EBSD) with automated Backscattered Electron (BSE) SEM image analysis for grain size measurement. This shift aims to reduce costs, measurement variability, and improve access to critical metrics.
EBSD Limitations
EBSD is noted for being time-consuming, requiring meticulous sample preparation, and having limited resolution compared to SEM imaging, making it less suitable for high-throughput applications despite its accuracy.
Case Study: Automated BSE SEM Image Analysis
A manufacturer attempted to replace EBSD with automated BSE SEM image analysis but initially faced challenges in detecting grain boundaries. Collaboration with Mipar Software led to the development of adaptive feature detection, enhancing accuracy.
Validation and Results
Grain size distribution comparisons between BSE and EBSD images showed a 97.3% agreement in mean grain size, supporting the feasibility of BSE imaging for accurate grain size analysis.
Implications
Switching to BSE imaging offers significant cost savings and increased throughput, processing samples faster and at a lower cost than EBSD.
Micrograph-Based Particle Analysis
This method retains particle shape information, allowing for more accurate predictions of aggregate behavior and is not limited by particle size, enabling analysis of particles in composite materials.
Reducing Errors in Graphite Classification
Automated micrograph analysis reduces human error and bias in graphite classification, with algorithms capable of simulating point counts and subclassifying material phases for high-speed, accurate measurements.
Conclusion
Technological advancements in microscopes, cameras, and computer algorithms, including machine learning, are enhancing microstructure characterization, allowing for automation of industry standards and improving accuracy and efficiency in materials analysis.
Algorithm Calibration and Error Analysis
The document discusses calibrating an algorithm to ASTM A247 standards for nodular graphite in ductile iron, with calibration results showing a root mean square error (RMSE) of 1.06% for count fraction and 1.08% for area fraction. Error analysis shows RMSE values of 9.23% for count fraction and 7.22% for area fraction, with figures illustrating the ambiguity in estimating graphite nodularity.
Challenges in Micrograph Analysis
The subjective nature of micrograph analysis is highlighted, particularly the lack of guidelines for including boundary graphite in nodularity classification. Automated algorithms are suggested to reduce human error and be calibrated for specific ranges, such as the 80-100% nodularity typical of ductile iron.
Industry Implications
The document calls for modernizing outdated standards to include guidelines and datasets that support automation in material development and characterization, enabling engineers to work more confidently.
References
Various studies and standards related to microstructure analysis, particle size distribution, and metal injection molding are cited, emphasizing the need for standardized methods in these areas.
Catalog excerpts

ADVANCED CHARACTERIZATION Automotive Aluminum Part V Photo Gallery: MS&T18 Highlights
Open the catalog to page 1
John Sosa, Pavel Sul, and Lawrence Small, MIPAR Software, Worthington, Ohio Advances in software algorithms and design enable automation of microstructure image analysis, leading to cost savings, reduction in measurement variability, and access to important metrics.
Open the catalog to page 2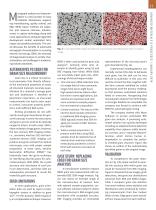
ALTERNATIVES TO EBSD FOR GRAIN SIZE MEASUREMENT Grain size is a critical microstructural parameter that directly influences the mechanical properties of nearly all structural materials. Accurate quantification of a material’s average grain size and distribution is therefore of paramount importance, as inaccurate measurements can lead to poor quality control, inaccurate property predictions, and inefficient R&D cycles. Etching procedures do not sufficiently reveal grain boundaries for optical microscopy in some microstructures and grains are too small to be optically imaged in others. In both...
Open the catalog to page 3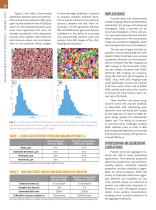
18 A more thorough sampling is required to properly compare standard deviation as well as minimum and maximum statistics between the two. Most importantly, a 97.3% agreement between BSE and EBSD mean grain size delivers confidence in the ability to accurately and automatically perform grain size analysis from BSE images of the challenging microstructure. Figure 2 and Table 1 show strong agreement between grain size distributions and summary statistics. BSE mean grain size deviated from that of EBSD by only 2.7%. The standard deviations also show close agreement, but were not strongly considered...
Open the catalog to page 4
Several techniques are available to characterize particle properties. For granular aggregate materials, the simplest technique to determine particle size distribution is sieve analysis[4,5]. After sifting through meshes of graduated sizes, the percent-by-mass of each size range and a fineness modulus of the material trapped by each sieve is calculated. The technique requires moving samples offline for analysis and it is unable to provide more detailed shape information. More sophisticated techniques such as acoustic emission avoid some of the limitations of sieve analysis. For example, acoustic...
Open the catalog to page 5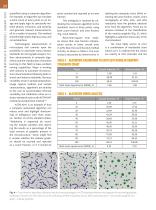
20 quantified using a computer algorithm. For example, an algorithm can simulate a point count at every point on an image and apply logic to subclassify material phases, inclusions, and porosity, and generate relevant measurements, all in a matter of seconds. This method provides high speed, high accuracy, and correctable bias. Technological advancements in microscopes and cameras open the possibility to automate many industry standards for micrograph analysis. Further, advancements in computer algorithms and the introduction of machine learning to this field increase problem solving capabilities....
Open the catalog to page 6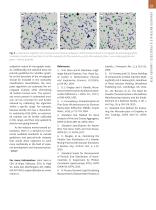
Fig. 5 — Area fraction algorithm error analysis results showing ambiguity in ASTM standard reference micrographs for estimating graphite nodularity in ductile iron (see Table 4): (a) 20% nodularity; (b) 30% nodularity; and (c) 40% nodularity (blue = non-nodular graphite and green = nodular graphite). subjective nature of micrograph analysis. Additionally, the standard does not provide guidelines for whether graphite on the boundary of the micrograph should be included in the nodularity classification. Nevertheless, the computer algorithm can automate the micrograph analysis while eliminating...
Open the catalog to page 7All MIPAR catalogs and technical brochures
 Porosity Analysis
2 Pages
 Cracks and Pores
2 Pages
 Aerial Applications
2 Pages
 Fibers Analysis
1 Page
 Fiber Cross Sections
2 Pages
 Coarse Fibers
2 Pages
 Satellite Particles
2 Pages
 Powder Particles
2 Pages
 Crystals
2 Pages
 Cracks in Particles
2 Pages
 Ti Alloy Microstructure
1 Page
 Gamma Prime Detection
1 Page
 Alpha Beta in Ti
1 Page
 Twin Grains Analysis
1 Page
 Grains Analysis
1 Page
 Largest Grain
1 Page
 Ceramics Grains 2
2 Pages
 Ceramic Grains
1 Page
 Beta Grains in Ti
1 Page
 MIPAR API
2 Pages
 Additive Manufacturing
1 Page
 Metals infographic
1 Page
 Ceramics infographic
1 Page
 Battery Flyer
1 Page
 Banner 2
1 Page
 Banner 1
1 Page
 MIPAR LIVE BROCHURE
4 Pages
 MIPAR - QAQC Brochure
12 Pages
 MIPAR Brochure
6 Pages


Archived catalogs
 Nanoparticles
2 Pages
 Deep Learning
1 Page
- Automation software solution
- Management software solution
- Analysis software solution
- Process software
- Real-time software
- Windows software
- Industrial software
- 3D software solution
- Measurement software
- Interface software
- Visualization software solution
- Quality software
- Automated software
- Development software
- Network software
- Reporting software
- Engineering software
- Machine software
- Optimization software
- Test software