- Catalogs
- MINITAB Ltd
- Minitab16 WhatsNew
- Products
- Catalogs
- News & Trends
- Exhibitions
Minitab16 WhatsNew
1 /12Pages

Minitab16 WhatsNew
1 /12Pages
Catalog excerpts

Statistical Software Upgrade now to access more than 70 new features and enhancements including greater statistical power, a new Assistant that guides you step-by-step through your analysis, and more.
Open the catalog to page 1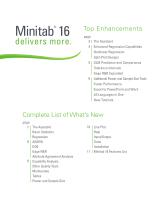
delivers more. page 3 The Assistant 4 Enhanced Regression Capabilities Nonlinear Regression Split-Plot Designs 5 GLM Prediction and Comparisons Tolerance Intervals Gage R&R Expanded Additional Power and Sample Size Tools Faster Performance Export to PowerPoint and Word All Languages in One New Tutorials Complete List of What’s New page 7 The Assistant Basic Statistics Regression 8 ANOVA DOE Gage R&R Attribute Agreement Analysis 9 Capability Analysis Other Quality Tools Multivariate Tables Power and Sample Size Line Plot Help Input/Output Tools Installation Minitab 16 Features List
Open the catalog to page 2
Let Minitab's new Assistant menu lead you through your analysis and help you interpret your results with confidence. Standard deviation Standard Deviation Follow an interactive decision tree to choose the right tool. Test setup ensure your analysis perform test • Colleda random sample of data. + • Colled enough data + • Enter the data in Ihe order that you collect it + • The process should be stable when you collectttie data. + * The data do notneedto be normally distributed. + • Examine unusual data points + What target do you want to test the mean against? What do you want to determine? (~...
Open the catalog to page 3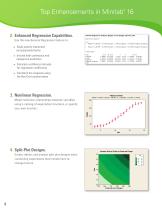
2. Enhanced Regression Capabilities Use the new General Regression feature to: ► Easily specify interaction ► Include both continuous and categorical predictors ► Calculate confidence intervals ► Transform the response using General Regression Analysis: Weight versus Height, Diameter, Site Regression Equation 1 Weight = 0.263341 + 0. 557629 Height - 1.47128 Diameter + 0.188015 Diametermiameter I 2 Weight - 0.353579 + 0.567829 Height - 1.47128 Diameter + 0.188015 Diameter*Diameter | Split-Plot Designs. Create, define, and analyze split-plot designs when conducting experiments that include hard-to-...
Open the catalog to page 4
General Linear Model (GLM) Prediction Compute predicted values and confidence intervals for new observations. Use the new grouping information table to easily compare the mean responses for individual factor levels. Grouping Information Using Tukey Method and 95.0^ Confidence Plant H Mean Grouping Means that do not share a letter are significantly different. Calculate bounds for a given proportion of a Tolerance Interval Plot for Hours At Least 99% of Population Covered Normal Probability Plot Normality Test Analyze studies that have missing data, include more than 2 factors, are crossed or nested,...
Open the catalog to page 5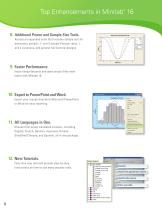
8. Additional Power and Sample Size Tools. Access an expanded suite that includes sample size for estimation, paired t, 1- and 2-sample Poisson rates, 1 and 2 variances, and general full factorial designs. Import large datasets and open project files even faster with Minitab 16. Power Curve for Paired t Test 10. Export to PowerPoint and Word. Export your results directly to Microsoft PowerPoint or Word for easy reporting. Choose from seven translated versions, including English, French, German, Japanese, Korean, Simplified Chinese, and Spanish, all in one package. Copy Graph Append Graph to Report...
Open the catalog to page 6
Complete List of What’s New The Assistant Use this new menu to analyze your data with confidence. The Assistant contains an interactive decision tree that helps you choose the right tool and walks you through your analysis step-by-step. It includes guidelines to ensure your analysis is successful, has a simplified interface that is easy to understand, and even provides comprehensive reports and interpretation of your output that you can use to present your results. Basic Statistics New Display Descriptive Statistics Options. You can now easily choose to display your preferred default statistics,...
Open the catalog to page 7
Complete List of What’s New ANOVA One-Way ANOVA – Comparisons. Easily compare the mean responses for individual factor levels using a new grouping information table. General Linear Model Improvements. Compute predicted values and confidence intervals for new observations. You can also use the new grouping information table to easily evaluate multiple comparisons and compare the mean responses for significant factors. DOE Split-Plot Designs. Create, define, and analyze split-plot designs when conducting experiments that include hard-to-change factors. Sum of Squares for Individual Terms. The ANOVA...
Open the catalog to page 8
Complete List of What’s New Capability Analysis Normal Capability Transformations. Normal capability analysis includes a new Transform button, providing easier accessibility to both the Box-Cox and Johnson transformations. Johnson Transformation Improvement. This transformation now computes capability indices even when the specification limits fall outside the range of the transformation. Improved Capability Sixpack. Choose to display the benchmark Z (sigma level) values. Output also now includes PPM . Other Quality Tools Improved Pareto Chart Interface. The new interface has been simplified...
Open the catalog to page 9
Complete List of What’s New Line Plot Display Y as a Percent. The line plot includes a new option to display the Y variable as a percent. Help New Tutorials. Forty-five new tutorials provide step-by-step instructions on how to use many popular tools. Meet Minitab Added to Help. The Meet Minitab guide for getting started is now conveniently located in the Help menu. More Sample Datasets. Several new datasets have been added, including those referenced in StatGuide, providing you with all the data needed to work through the Help examples. Input/Output Faster Performance for Datasets and Project...
Open the catalog to page 10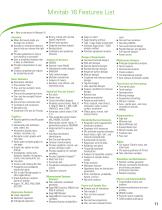
Minitab 16 Features List u= Assistant u Menu that easily leads you through your analysis u Includes an interactive decision tree to help you choose the right tool u Provides guidelines to ensure your analysis is successful u Uses a simplified interface that is easy to understand u Provides interpretation of your output u Creates comprehensive reports for presenting results Basic Statistics u Descriptive statistics • One-sample Z test • One- and two-sample t-tests, paired t-test • One and two proportions tests • One- and two-sample Poisson rate tests u One and two variances tests • Correlation...
Open the catalog to page 11All MINITAB Ltd catalogs and technical brochures
 Minitab 17 Learn What’s New
8 Pages
 Minitab 17 Getting Started
87 Pages
 Meet Minitab
122 Pages

- ERLO management software
- Automation software solution
- Analysis software solution
- Process software
- Real-time software
- Computer-aided design software
- Cloud-based software
- Control software
- Design software solution
- Monitoring software solution
- Interface software
- ERLO measurement software
- Quality software
- Visualization software solution
- Reporting software
- Creation software
- Optimization software
- Test software
- Modeling software
- Data analysis software