
- Catalogs
- MINITAB Ltd
- Minitab 17 Learn What’s New


Minitab 17 Learn What’s New

Minitab 17 Learn What’s New
- Assistant Menu: Guides users through analysis with improved support for DOE, Multiple Regression, and Graphical Analysis. It also includes enhanced guidance for Measurement Systems Analysis, Capability Analysis, Hypothesis Tests, and Control Charts.
- Data Customization and Manipulation: New features such as conditional formatting, enhanced subset and sort options, and data customization tools allow users to explore data directly in the worksheet.
- Regression, ANOVA, and DOE: Improved workflow for regression, ANOVA, and DOE with new response optimizer options and automatic model selection.
- New Statistical Tools: Includes Bubble Plot, Outlier Tests, Poisson Regression, Stability Studies, and Equivalence Testing.
- Language Support: Minitab 17 is available in multiple languages including Portuguese, English, French, German, Japanese, Korean, Simplified Chinese, and Spanish.
- Updated Graphics: Modernized color palette and fonts for clearer presentations.
- Basic Statistics: Includes descriptive statistics, various tests (Z-test, t-tests, Poisson rate tests), correlation, and covariance.
- Graphics: Offers a range of plots and charts, including scatterplots, matrix plots, and bubble plots, with customizable attributes.
- Regression: Supports linear, logistic, nonlinear, and Poisson regression, with tools for response prediction and optimization.
- Analysis of Variance (ANOVA): Includes general linear models, MANOVA, and multiple comparisons.
- Statistical Process Control: Features various control charts and process capability analysis tools.
- Design of Experiments (DOE): Offers factorial, split-plot, and response surface designs, among others.
- Reliability/Survival Analysis: Provides tools for distribution analysis, life testing, and reliability test plans.
- Power and Sample Size: Includes calculations for sample size and power for various tests and designs.
- Multivariate Analysis: Features principal components, factor, discriminant, and cluster analysis.
- Time Series and Forecasting: Offers tools for trend analysis, decomposition, and ARIMA models.
- Nonparametrics: Includes tests like the sign test, Wilcoxon test, and Kruskal-Wallis test.
- Equivalence Tests: Supports one- and two-sample, paired, and crossover design tests.
- Simulation and Distributions: Provides random number generation and distribution functions.
- Macros and Customizability: Allows for customizable menus, toolbars, and extensive user preferences.
Catalog excerpts

Statistical Software Learn What’s New Upgrade now to access new and improved statistical features and other enhancements that make it even easier to analyze your da
Open the catalog to page 1
Let Minitab's Assistant menu lead you through your analysis and help you interpret your results with confidence—now with DOE, Multiple Regression, and improved Graphical Analysis. We've also enhanced our guidance for Measurement Systems Analysis, Capability Analysis, Hypothesis Tests, and Control Charts. Plan and Create Experiments ii Follow an interactive decision tree to plan and create experiments, including both screening and Test setup The relationship between Y and the X variables in the model is
Open the catalog to page 2
Data Customization and Manipulation Explore your data directly in the worksheet with a simple right-click. New features include conditional formatting, enhanced subset and sort options, and data customization tools. Instantly identify frequent values, out-of-control points, out-of-spec measurements, and more. Create custom subsets based on conditional formats to investigate relationships between variables. Highlight worksheet cells, columns, and rows; add cell comments; or easily change a column’s data type.
Open the catalog to page 3
Explore relationships between variables with new features and an improved workflow for Interaction Plot for Temp A gray background represents a term not in the model. ii Instantly identify important variables using automatic model selection. Contour Plot of Density vs Strength, Minutes Visually explain your results with more graphs, including main effects, interaction, contour, and surface plots. ►► Main Effects Plot for Yield Fitted Means ii Include categorical factors in your response surface designs. Find optimal settings with new response optimizer options.
Open the catalog to page 4
New and Improved Statistical Tools Bubble Plot of Movie Sales vs Book Reviews Bubble size: Budget Book Reviews Graph the relationship between three or four variables in a two- dimensional space by plotting the X and Y variables, with bubble size representing the third variable. Investigate relationships between variables when the response describes counts, such as the number of machine failures or caesarean sections at a hospital. Poisson Regression Analysis Link function Natural log Deviance Table Outlier Plot of BreakStrength Grubbs' Test Use Grubbs' and Dixon's Tests to detect an
Open the catalog to page 5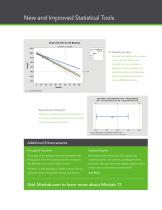
New and Improved Statistical Tools Shelf Life Plot for All Batches - Fitted Line Analyze the stability of a product its shelf life. For example, a study the relationship between drug concentration and time across different batches. Determine whether the means for product or process measurements are close enough Equivalence Test: Mean(Discount) - Mean(Original) (LEL = Lower Equivalence Limit, UEL = Upper Equivalence Limit) CI Is within the equivalence interval of (-0.5, 0.5). Can claim equivalence. Additional Enhancements Portuguese Translation Every part of the software has been translated into...
Open the catalog to page 6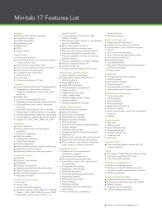
Minitab 17 Features List Assistant Measurement Systems Analysis Capability Analysis Graphical Analysis Hypothesis Tests Regression DOE Control Charts Basic Statistics • Descriptive statistics One-sample Z-test, one- and two-sample t-tests, paired t-test One and two proportions tests One- and two-sample Poisson rate tests One and two variances tests Correlation and covariance • Normality test Outlier test • Poisson goodness-of-fit test Graphics Easily create professional-looking graphics • Scatterplots, matrix plots, boxplots, dotplots, histograms, charts, time series...
Open the catalog to page 7
Learn more and find a local Minitab representative at www.minitab.com. Minitab®, Quality. Analysis. Results.® and the Minitab® logo are all registered trademarks of Minitab, Inc., in the United States and other countries. See minitab.com/legal/trademarks for more information.
Open the catalog to page 8All MINITAB Ltd catalogs and technical brochures
 Minitab 17 Getting Started
87 Pages
 Minitab16 WhatsNew
12 Pages
 Meet Minitab
122 Pages

- Automation software solution
- Management software solution
- Analysis software solution
- Process software
- Real-time software
- Computer-aided design software
- Cloud-based software
- Control software
- Design software solution
- Monitoring software solution
- Measurement software
- Interface software
- Visualization software solution
- Quality software
- Reporting software
- Creation software
- Optimization software
- Test software
- Modeling software
- Data analysis software