
- Catalogs
- MINITAB Ltd
- Minitab 17 Getting Started


Minitab 17 Getting Started

Minitab 17 Getting Started
This document serves as a comprehensive guide to using Minitab 17 for data analysis, focusing on a case study involving a company with three regional shipping centers. The primary goal is to identify the most efficient computer system among the centers by analyzing shipping data.
Main Sections
- Data Exploration and Analysis: Chapters 2 through 5 cover exploring data with graphs, conducting statistical analyses, assessing quality, and designing experiments.
- Automation and Customization: Chapters 6 through 10 focus on automating analyses, generating reports, preparing worksheets, and customizing Minitab.
Case Study Overview
The company aims to determine the most efficient computer system by analyzing data from its shipping centers. The analysis involves creating graphs, performing statistical analyses, and conducting experiments to improve processes.
Minitab User Interface
The Minitab interface includes a Session window for text results, a Worksheet for data entry, and a Project Manager for managing projects. Projects can contain multiple worksheets and store various elements like graphs and session outputs.
Data Types and Management
Worksheets can contain numeric, text, and date/time data. Data can be imported from files like Excel, and changes in Minitab do not affect the original files.
Graphs are used to explore data characteristics, check normality, compare means, and examine variable relationships. Minitab offers features like customizable graphs and automatic updates. Histograms and scatterplots are used to analyze delivery times and relationships between variables. The Western center shows the fastest delivery time with the least variability.
Statistical methods like ANOVA are used to test differences between means. The document guides users through summarizing data, comparing means, and using Minitab's StatGuide and Project Manager. The analysis indicates significant differences in delivery times between the centers, with the Western center being the most efficient.
The document introduces control charts to assess process stability and capability. Control charts help detect special-cause variation and ensure the process operates within specifications. The Western center's process is analyzed for stability and capability, given its fastest delivery time.
DOE is used to investigate the effects of input variables on an output variable. Minitab offers various designs, including factorial, response surface, mixture, and Taguchi designs. The document guides users through creating a factorial design to examine the relationship between factors like order-processing systems and packing procedures.
The document introduces session commands as an efficient way to re-run analyses. It explains how to enable and enter session commands, perform analyses using these commands, and save them as exec files for future use.
Learn to add graphs and session window output to the ReportPad, edit and save reports, and transfer content to word processors or PowerPoint. The document provides instructions on customizing titles, adding comments, and saving reports in different formats for sharing.
Guidance on obtaining data from various sources and preparing it for analysis. Instructions are provided for entering data directly, copying from other applications, or importing from Excel and text files.
Instructions on setting options, creating toolbars, and assigning shortcuts. The document covers changing default settings for graphs, toolbars, and shortcut keys using 'Tools > Options' and 'Tools > Customize'.
Utilize Minitab’s help resources, including Minitab Help, StatGuide, and Session Command Help, for guidance on using Minitab's features, including statistical and graphical commands.
Catalog excerpts

Getting Started with Minitab 17
Open the catalog to page 1
2013 by Minitab Inc. All rights reserved. Minitab®, Quality. Analysis. Results.® and the Minitab logo are registered trademarks of Minitab, Inc., in the United States and other countries. Additional trademarks of Minitab Inc. can be found at www.minitab.com. All other marks referenced remain the property of their respective owners. Release 17.1.0
Open the catalog to page 2
Getting Started with Minitab 17
Open the catalog to page 4
Learn about the Minitab user interface Open and examine a worksheet Overview Getting Started with Minitab 17 introduces you to some of the most commonly used features and tasks in Minitab. Most statistical analyses require that you follow a series of steps, often directed by background knowledge or by the subject area that you are investigating. Chapters 2 through 5 illustrate the following steps: Explore data with graphs Conduct statistical analyses Assess quality Design an experiment In chapters 6 through 10, you learn to do the following: Use shortcuts to automate future analyses Generate...
Open the catalog to page 5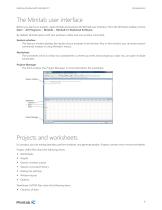
Getting Started with Minitab 17 The Minitab user interface Before you start your analysis, open Minitab and examine the Minitab user interface. From the Windows taskbar, choose Start > All Programs > Minitab > Minitab 17 Statistical Software. By default, Minitab opens with two windows visible and one window minimized. Session window The Session window displays the results of your analyses in text format. Also, in this window, you can enter session commands instead of using Minitab’s menus. Worksheet The worksheet, which is similar to a spreadsheet, is where you enter and arrange your data. You...
Open the catalog to page 6
Getting Started with Minitab 17 Constants Matrices Design objects Column descriptions Worksheet descriptions Save your work as a project file to keep all of your data, graphs, dialog box settings, and options together. Save your work as a worksheet file to save only the data. A worksheet file can be used in multiple projects. Worksheets can have up to 4,000 columns. The number of worksheets that a project can have is limited only by your computer's memory. Data types A worksheet can contain the following types of data. Numeric data Numbers, such as 264 or 5.28125. Text data Letters, numbers,...
Open the catalog to page 7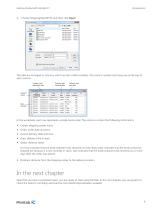
Getting Started with Minitab 17 4. Choose Shipping Data.MTW, and then click Open. Shipping Data. MTW| ^ j Look in Minitab Sample Data folder Date modified The data are arranged in columns, which are also called variables. The column number and name are at the top of each column. Column with date/time data Column with Column with numeric data text data In the worksheet, each row represents a single book order. The columns contain the following information: • Center: shipping center name • Order: order date and time • Arrival: delivery date and time • Days: delivery time in days • Status: delivery...
Open the catalog to page 8
2 Graphing Data Objectives • • • • Create, interpret, and edit histograms Create and interpret scatterplots with the Minitab Assistant Arrange multiple graphs on one page Save a project Overview Before you perform a statistical analysis, you can use graphs to explore data and assess relationships between the variables. Also, you can use graphs to summarize data and to help interpret statistical results. You can access Minitab’s graphs from the Graph and Stat menus. Built-in graphs, which help you interpret results and assess the validity of statistical assumptions, are also available with many...
Open the catalog to page 9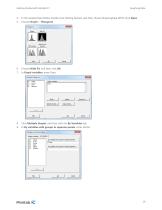
Getting Started with Minitab 17 Graphing Data 4. In the Sample Data folder, double-click Getting Started, and then choose Shipping Data.MTW. Click Open. 5. Choose Graph > Histogram. With Groups Groups 6. Choose With Fit, and then click OK. 7. In Graph variables, enter Days. Graph variables: Multiple Graphs.. Data Options.. 8. Click Multiple Graphs, and then click the By Variables tab. 9. In By variables with groups in separate panels, enter Center. Histogram ML tiple Graphs Multiple Variables By Variables | By variables with groups in separate panels: By variables with groups on separate graphs:...
Open the catalog to page 10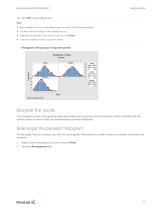
Getting Started with Minitab 17 Graphing Data 10. Click OK in each dialog box. To select variables in most Minitab dialog boxes, use one of the following methods: • Double-click the variables in the variables list box. • Highlight the variables in the list box, and then click Select. • Type the variables' names or column numbers. Histogram with groups in separate panels The histograms seem to be approximately bell-shaped and symmetric about the means, which indicates that the delivery times for each center are approximately normally distributed. Rearrange the paneled histogram For the graph that...
Open the catalog to page 11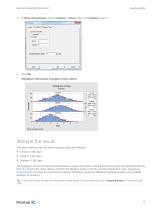
Getting Started with Minitab 17 Graphing Data 3. In Rows and Columns, choose Custom. In Rows, enter 3. In Columns, enter 1. Edit Panels Panels Arrangement | Options | Font | Margins between panels: [o (0-0.25) Histogram with panels arranged in one column The mean delivery times for each shipping center are different: The histogram shows that the Central and Eastern centers are similar in both mean delivery time and spread of delivery time. In contrast, the mean delivery time for the Western center is shorter and the distribution is less spread out. Analyzing Data on page 21 shows how to detect...
Open the catalog to page 12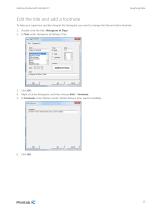
Getting Started with Minitab 17 Graphing Data Edit the title and add a footnote To help your supervisor quickly interpret the histogram, you want to change the title and add a footnote. 1. Double-click the title, Histogram of Days. 2. In Text, enter Histogram of Delivery Time. Shonar Bangla Showcard Gothic Simplified Arabic Color: Automatic | Histogram of Delivery Time| 4. Right-click the histogram, and then choose Add > Footnote. 5. In Footnote, enter Western center: fastest delivery time, lowest variability. | Western center: fastest delivery timej lowest variability
Open the catalog to page 13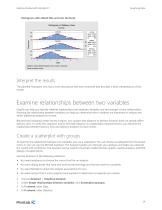
Getting Started with Minitab 17 Graphing Data Histogram with edited title and new footnote Histogram of Delivery Time itDev LIBS Wfcrem center: fastest delivery time, lowest variabiiity Panei variable: Center The paneled histogram now has a more descriptive title and a footnote that provides a brief interpretation of the Examine relationships between two variables Graphs can help you identify whether relationships exist between variables, and the strength of any relationships. Knowing the relationship between variables can help you determine which variables are important to analyze and which...
Open the catalog to page 14All MINITAB Ltd catalogs and technical brochures
 Minitab 17 Learn What’s New
8 Pages
 Minitab16 WhatsNew
12 Pages
 Meet Minitab
122 Pages

- Automation software solution
- Management software solution
- Analysis software solution
- Process software
- Real-time software
- Computer-aided design software
- Cloud-based software
- Control software
- Design software solution
- Monitoring software solution
- Measurement software
- Interface software
- Visualization software solution
- Quality software
- Reporting software
- Creation software
- Optimization software
- Test software
- Modeling software
- Data analysis software