- Catalogs
- The MathWorks
- Stateflow
Stateflow
1 /8Pages

Stateflow
1 /8Pages
Catalog excerpts
Stateflow Design and simulate state machines Stateflow® is an environment for modeling and simulating combinatorial and sequential decision logic based on state machines and flow charts. Stateflow lets you combine graphical and tabular representations, including state transition diagrams, flow charts, state transition tables, and truth tables, to model how your system reacts to events, time-based conditions, and external input signals. With Stateflow you can design logic for supervisory control, task scheduling, and fault management applications. Stateflow includes state diagram animation and static and run-time checks for testing design consistency and completeness before implementation. Key Features ▪ Modeling environment, graphical components, and simulation engine for modeling and simulating complex logic ▪ Deterministic execution semantics with hierarchy, parallelism, temporal operators, and events ▪ State diagrams, state transition tables, and state transition matrices representing finite state machines ▪ Flow charts, MATLAB functions, and truth tables for representing algorithms ▪ State diagram animation, state activity logging, data logging, and integrated debugging for analyzing the design and detecting run-time errors ▪ Static and run-time checks for transition conflicts, cyclic problems, state inconsistencies, data-range violations, and overflow conditions ▪ Mealy and Moore finite-state machines Getting Started with Stateflow 3:25 Learn to build and simulate a state machine. Designing Logic Stateflow provides graphical and tabular interfaces for modeling system logic using state machines. In a state machine, you model the system’s modes of operation as states and represent the logic for switching between modes using transitions and junctions. You can model the different components in your system as states that execute exclusively or in parallel. Stateflow lets you manage the complexity of your design by organizing state diagram objects, functions, and components hierarchically. In Stateflow you can represent combinatorial logic graphically with flow charts and in tabular format with truth tables. Designing logic involves defining conditions to be checked and subsequent actions to be performed. Stateflow enables you to define conditions and actions in C or in MATLAB®. You can manage the data used in conditions and actions from the Simulink® Model Explorer. Before executing your design, Stateflow notifies you of possible state inconsistencies, unused data and events, and invalid transitions.
Open the catalog to page 1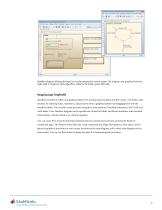
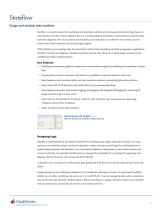
flang-Bang Cwrtre*w to iisF_bDtler * QBang-Bang CnnlroKer ► entry: turn_bcHler(OFF) % SUtedow (wrxfi*rT| ^boiler/Bang- Sang Con[roller/Ci*n_boilef I a f liD Uitf File Edit View Display Chan Simulation Analysis Code Toolj Hetp * i^sf.bniltr * QBaflg'Bang Controller * Qtum_boiler Stateflow diagram defining the logic for a boiler temperature control system. The diagram uses graphical functions (right side) to implement utility algorithms called by the heater system (left side). Designing Logic Graphically Stateflow provides an editor and graphical objects for drawing state machines and flow charts....
Open the catalog to page 2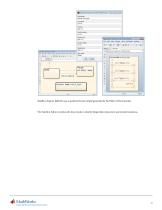
file E<J'< QisplBy cm-n SimuidiHMi flnaijuu £enle looii HHp I Stateflow Pattern: IF-ELSEIF-ELSEIF-ELSE I a J| 0 l| £3 Packet Send Logic Elseif condition: EFseif action: function task = sendjogic function task = send_logic Stateflow diagram (left) that uses a graphical function (right) generated by the Pattern Wizard (center). The Stateflow Editor provides edit-time checks to identify illegal object placement and invalid transitions. Accelerating the pace of engineering and science
Open the catalog to page 3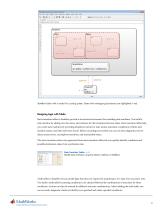
*j Stateflow (ctwrt) jf_aiKontroVAir Comfoiier ■ Ealt £<Jit Ytew ffisruay Chart Simulation analysis cod* lools Help i%isl_aifConvoi»QAir CorNroller Stateflow Editor with a model of a cooling system. States with overlapping boundaries are highlighted in red. Designing Logic with Tables State transition tables in Stateflow provide a structured environment for modeling state machines. You build a state machine by adding rows for states, and columns for the transitions between states. State transition tables help you create state machines by providing dropdown menus for state names, automatic completion...
Open the catalog to page 4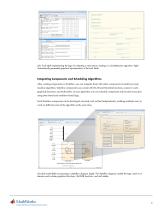
4 Staieflow (£n*h cable} *f>roaft/Meide LagitR.iwiich" I o [ 3 1 H File Edit Senngi Add Help (.eft; Truth table implementing the logic for selecting a valid sensor reading in a fault-detection algorithm. Right: Automatically generated graphical representation of the truth table. Integrating Components and Scheduling Algorithms After creating components in Stateflow, you can integrate them with other components to build your state machine algorithm. Stateflow components can contain MATLAB and Simulink functions, custom C code, graphical functions, and truth tables. In your algorithm, you can schedule...
Open the catalog to page 5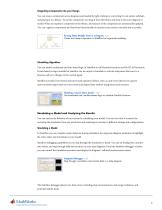
Integrating Components into your Design You can reuse a component across diagrams and models by right-clicking it, converting it to an atomic subchart, and placing it in a library. To use the component, you drag it from the library and drop it into your diagram or model. When you update a component in the library, all instances of the component are automatically updated. You can organize components and functions hierarchically to represent your system concisely and accurately. Reusing States Multiple Times in a Diagram 3:47 Create and reuse components in Stateflow for large-scale modeling. Scheduling...
Open the catalog to page 6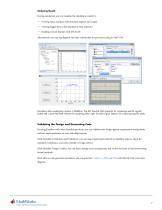
Analyzing Results During simulation you can visualize the simulation results by: ▪ Viewing states and data with Simulink displays and scopes ▪ Viewing logged data in the Simulation Data Inspector ▪ Building custom displays with MATLAB Alternatively, you can log diagram and state activity data for post-processing in MATLAB. Simulation data visualization options in Stateflow. Top left: Simulink Data Inspector for comparing specific signals; bottom left: custom MATLAB interface for analyzing data; right: Simulink Signal Selector for comparing specific states. Validating the Design and Generating...
Open the catalog to page 7All The MathWorks catalogs and technical brochures
 MATLAB Production Server
6 Pages
 Database Toolbox
4 Pages
 MATLAB Report Generator
4 Pages
 SimEvents
7 Pages
 SimDriveline
7 Pages
 SimHydraulics
7 Pages
 SimPowerSystems
8 Pages
 Simulink Control Design
5 Pages
 Aerospace Blockset
5 Pages
 SimRF
SimRF6 Pages
 Simulink Coder
6 Pages
 Embedded Coder
8 Pages
 Simulink PLC Coder
4 Pages
 Fixed-Point Designer
9 Pages
 MATLAB Coder
5 Pages
 Simulink 3D Animation
10 Pages
 Gauges Blockset
2 Pages
 Simulink Report Generator
3 Pages
 Polyspace Bug Finder
6 Pages
 global-optimization-toolbox
10 Pages
 Phased Array System Toolbox
9 Pages
 OPC Toolbox
5 Pages
 Simulink Design Verifier
7 Pages
 Simulink Design Optimization
10 Pages
 Filter Design HDL Coder
5 Pages
 Bioinformatics Toolbox
9 Pages
 SimBiology
6 Pages
 Computer Vision System Toolbox
10 Pages
 DSP System Toolbox
11 Pages
 Fuzzy Logic Toolbox
5 Pages
 Polyspace Client for C/C++
5 Pages
 xPC Target
5 Pages
 SimMechanics
7 Pages
 Simscape
7 Pages
 Simulink
6 Pages
 Data Acquisition Toolbox
8 Pages
 Image Processing Toolbox
7 Pages
 Signal Processing Toolbox
10 Pages
 Control System Toolbox
6 Pages
 Symbolic Math Toolbox?
6 Pages
 Parallel Computing Toolbox?
7 Pages
 MATLAB®
6 Pages
 Mapping Toolbox 3.2
7 Pages
 Instrument Control Toolbox
7 Pages
 Optimization Toolbox 6.0
14 Pages


Archived catalogs
 MATLAB Release Notes
505 Pages
 C and Fortran API Reference
263 Pages
 External Interfaces
649 Pages
 Function Reference: Volume 3 (P-Z)
1696 Pages
 Function Reference: Volume 2 (F-O)
1568 Pages
 Function Reference: Volume 1 (A-E)
1298 Pages
 Creating Graphical User Interfaces
520 Pages
 3-D Visualization
212 Pages
 Graphics
667 Pages
 MATLAB Programming Tips
66 Pages
 Programming Fundamentals
840 Pages
 Data Analysis
220 Pages
 Mathematics
316 Pages
 MATLAB® Getting Started Guide
250 Pages


- ERLO management software
- Automation software solution
- Analysis software solution
- Process software
- ERLO Windows software
- Real-time software
- Computer-aided design software
- Cloud-based software
- Control software
- Design software solution
- 3D software solution
- ERLO measurement software
- Visualization software solution
- Simulation software solution
- Automated software
- Programming software
- Network software
- Reporting software
- Engineering software
- Machine software