- Catalogs
- The MathWorks
- MATLAB® Getting Started Guide
MATLAB® Getting Started Guide

MATLAB® Getting Started Guide
This document provides an overview of MATLAB, a high-performance language for technical computing. It covers the MATLAB environment, system components, and available documentation. Instructions for starting and quitting MATLAB are also included.
This section explains the creation and manipulation of matrices and arrays in MATLAB, including operations like transposition, summation, and the use of functions such as
sum and diag. It also covers subscripts, indexing, and the colon operator for accessing matrix elements.The document details MATLAB's plotting capabilities, including creating, editing, and exporting graphs. It covers basic and advanced plotting functions, mesh and surface plots, and the use of plotting tools for graph customization.
This section discusses MATLAB programming concepts, including flow control, error handling, and program termination. It covers data structures like multidimensional arrays and cell arrays, as well as scripts and functions, including object-oriented programming.
The document introduces data preprocessing, summarizing, visualizing, and modeling techniques. It covers handling missing data, smoothing, and using regression models for data analysis.
This section introduces GUIDE, MATLAB's tool for creating GUIs, explaining layout design and programming of GUIs using callbacks.
The document provides an overview of the MATLAB desktop, including workspace management, the Command Window, and the use of the Help browser. It also covers the Editor for creating and debugging M-files.
MATLAB's external interfaces allow integration with other programs and devices, including C, Fortran, Java, and web services. The document outlines how to use these interfaces to extend MATLAB's functionality.
Catalog excerpts
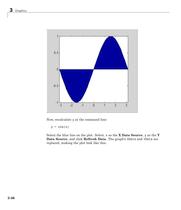
Graphics Now,recalculate > y atthecommandline: > y=cos(x) Selectthebluelineontheplot.Select, > x asthe XDataSource , > y asthe YDataSource ,andclick RefreshData .Thegraphs > XData and > YData arereplaced,makingtheplotlooklikethis. >
Open the catalog to page 92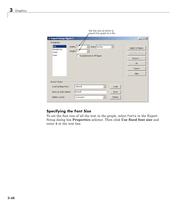
Tosetthefontsizeofallthetextinthegraph,select > Fonts intheExportSetupdialogbox Properties selector.Thenclick Usefixedfontsize andenter > 8 inthetextbox. >
Open the catalog to page 104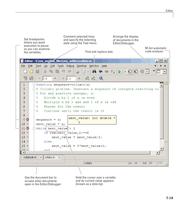
Editor Use the document bar toaccess other documentsopen in the Editor/Debugger.Hold the cursor over a variableand its current value appears (known as a data tip). Set breakpointswhere you want execution to pause so you can examine the variables.Comment selected linesand specify the indenting style using the Text menu.Find and replace text.Arrange the displayof documents in theEditor/Debugger.M-lint automaticcode analyzer. 7-19 >
Open the catalog to page 231All The MathWorks catalogs and technical brochures
 MATLAB Production Server
6 Pages
 Database Toolbox
4 Pages
 MATLAB Report Generator
4 Pages
 Stateflow
8 Pages
 SimEvents
7 Pages
 SimDriveline
7 Pages
 SimHydraulics
7 Pages
 SimPowerSystems
8 Pages
 Simulink Control Design
5 Pages
 Aerospace Blockset
5 Pages
 SimRF
SimRF6 Pages
 Simulink Coder
6 Pages
 Embedded Coder
8 Pages
 Simulink PLC Coder
4 Pages
 Fixed-Point Designer
9 Pages
 MATLAB Coder
5 Pages
 Simulink 3D Animation
10 Pages
 Gauges Blockset
2 Pages
 Simulink Report Generator
3 Pages
 Polyspace Bug Finder
6 Pages
 global-optimization-toolbox
10 Pages
 Phased Array System Toolbox
9 Pages
 OPC Toolbox
5 Pages
 Simulink Design Verifier
7 Pages
 Simulink Design Optimization
10 Pages
 Filter Design HDL Coder
5 Pages
 Bioinformatics Toolbox
9 Pages
 SimBiology
6 Pages
 Computer Vision System Toolbox
10 Pages
 DSP System Toolbox
11 Pages
 Fuzzy Logic Toolbox
5 Pages
 Polyspace Client for C/C++
5 Pages
 xPC Target
5 Pages
 SimMechanics
7 Pages
 Simscape
7 Pages
 Simulink
6 Pages
 Data Acquisition Toolbox
8 Pages
 Image Processing Toolbox
7 Pages
 Signal Processing Toolbox
10 Pages
 Control System Toolbox
6 Pages
 Symbolic Math Toolbox?
6 Pages
 Parallel Computing Toolbox?
7 Pages
 MATLAB®
6 Pages
 Mapping Toolbox 3.2
7 Pages
 Instrument Control Toolbox
7 Pages
 Optimization Toolbox 6.0
14 Pages


Archived catalogs
 MATLAB Release Notes
505 Pages
 C and Fortran API Reference
263 Pages
 External Interfaces
649 Pages
 Function Reference: Volume 3 (P-Z)
1696 Pages
 Function Reference: Volume 2 (F-O)
1568 Pages
 Function Reference: Volume 1 (A-E)
1298 Pages
 Creating Graphical User Interfaces
520 Pages
 3-D Visualization
212 Pages
 Graphics
667 Pages
 MATLAB Programming Tips
66 Pages
 Programming Fundamentals
840 Pages
 Data Analysis
220 Pages
 Mathematics
316 Pages


- ERLO management software
- Automation software solution
- Analysis software solution
- Process software
- ERLO Windows software
- Real-time software
- Computer-aided design software
- Cloud-based software
- Control software
- Design software solution
- 3D software solution
- ERLO measurement software
- Visualization software solution
- Simulation software solution
- Automated software
- Programming software
- Network software
- Reporting software
- Engineering software
- Machine software