
- Catalogs
- The MathWorks
- Mapping Toolbox 3.2

- Products
- Catalogs
- News & Trends
- Exhibitions
Mapping Toolbox 3.2

Mapping Toolbox 3.2
Mapping Toolbox™ 3.2 is a comprehensive toolset for analyzing and visualizing geographic data within MATLAB®. It supports importing vector and raster data from various formats and web-based sources, allowing for extensive customization and analysis of geospatial data.
Key Features
- Data Import and Export: Supports a wide range of GIS and geospatial file formats, including GeoTIFF, shapefiles, and more. It allows for efficient data handling by reading portions of files and downsampling data.
- Web Map Service (WMS) Access: Enables retrieval of raster data from WMS servers, facilitating access to diverse datasets like elevation and weather data.
- 2D and 3D Map Displays: Offers visualization functions for creating customized map displays, supporting both simple and complex data overlays.
- Digital Terrain and Elevation Analysis: Provides tools for visualizing and analyzing 3D data, including terrain and bathymetry, with functions for gradient and viewshed calculations.
- Geometric Geodesy and Map Projections: Includes over 65 map projections and utilities for geodetic calculations, supporting both spherical and ellipsoidal models.
Data Handling and Utilities
The toolbox provides utilities for manipulating geographic data, including splitting, merging, and reordering data points. It also supports interpolation and conversion between different data formats and coordinate systems.
Applications
Mapping Toolbox is suitable for a variety of geospatial applications, such as weather prediction, terrain analysis, and optimal site selection for infrastructure projects. It integrates with MATLAB and other toolboxes for enhanced functionality.
Resources
- Product Details and Demos: www.mathworks.com/products/mapping
- Trial Software: www.mathworks.com/trialrequest
- Technical Support: www.mathworks.com/support
Catalog excerpts
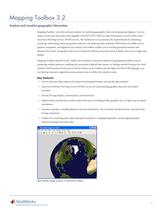
Instrument Control Toolbox table.main {} tr.row {} td.cell {} div.block {} div.paragraph {} .font0 { font:8.00pt "Times New Roman", serif; } .font1 { font:15.00pt "Times New Roman", serif; } .font2 { font:5.00pt "Trebuchet MS", sans-serif; } .font3 { font:7.00pt "Trebuchet MS", sans-serif; } .font4 { font:9.00pt "Trebuchet MS", sans-serif; } .font5 { font:10.00pt "Trebuchet MS", sans-serif; } .font6 { font:19.00pt "Trebuchet MS", sans-serif; } Mapping Toolbox 3.2 Analyze and visualize gographie information Mapping Toolbox provides tools and utilities for analyzing g险ographie data and creating map displays. You can import veetor and raster data from shapefile, GeoTIFF, SDTS DEM, or other file formats, as well as Web-based data from Web Map Service (WMS) servers. The toolbox lets you eustomize the imported data by subsetting, trimming, interseeting, adjusting spatial resolution, and applying other methods. With features for fields such as geodesy, navigation, and digital terrain analysis, the toolbox enables you to develop geospatial analyses and illustrate the results. Geographic data can be combined with base map layers from multiple sources in a single map display. Mapping Toolbox and MATLAB enable you to develop customized solutions to geospatial problems such as predicting weather patterns, modeling the movement of glacial land masses, or finding optimal locations for wind turbines. With function-level access to all key features in the toolbox and the high-level MATLAB language, you can develop innovative algorithms and automate your workflow for repetitive tasks. Key Features ■ Vector and raster data import and export from standard formats and specific data products ■ Data retrieval from Web Map Service (WMS) servers for customized geographic data sets and related metadata ■ 2D and 3D map display, customization, and interaction ■ Digital terrain and elevation model analysis functions, including profile, gradient, line-of-sight, and viewshed calculations ■ Geometric geodesy, including distance and area calculations, 3D coordinate transformations, and more than 65 map projections ■ Utilities for converting units, adjusting spatial resolution, wrapping longitudes, and managing spatially referenced images and raster data Blue Marble image courtesy of NASA-JPL/Caltech. ^MathWorks Accelerating the pace of engineering and science
Open the catalog to page 1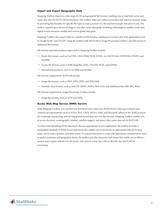
Instrument Control Toolbox table.main {} tr.row {} td.cell {} div.block {} div.paragraph {} .font0 { font:7.00pt "Times New Roman", serif; } .font1 { font:8.00pt "Times New Roman", serif; } .font2 { font:15.00pt "Times New Roman", serif; } .font3 { font:5.00pt "Trebuchet MS", sans-serif; } .font4 { font:9.00pt "Trebuchet MS", sans-serif; } Import and Export Gographie Data Mapping Toolbox imports a wide range of GIS and geospatial file formats, enabling you to read both vector and raster data into the MATLAB environment. The toolbox helps you reduce access time and improve memory usage by providing...
Open the catalog to page 2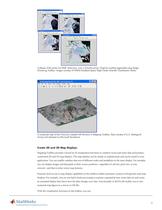
Instrument Control Toolbox table.main {} tr.row {} td.cell {} div.block {} div.paragraph {} .font0 { font:7.00pt "Times New Roman", serif; } .font1 { font:8.00pt "Times New Roman", serif; } .font2 { font:15.00pt "Times New Roman", serif; } .font3 { font:5.00pt "Trebuchet MS", sans-serif; } .font4 { font:7.00pt "Trebuchet MS", sans-serif; } .font5 { font:9.00pt "Trebuchet MS", sans-serif; } Collapse of the Larsen Ice Shelf, Antarctica, over a 3-month period. Original coastline segmented using Image Processing Toolbox. Images courtesy of NASA/Goddard Space Flight Center Scientific Visualization...
Open the catalog to page 3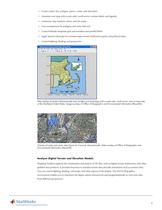
Instrument Control Toolbox table.main {} tr.row {} td.cell {} div.block {} div.paragraph {} .font0 { font:7.00pt "Times New Roman", serif; } .font1 { font:8.00pt "Times New Roman", serif; } .font2 { font:15.00pt "Times New Roman", serif; } .font3 { font:5.00pt "Trebuchet MS", sans-serif; } .font4 { font:7.00pt "Trebuchet MS", sans-serif; } .font5 { font:9.00pt "Trebuchet MS", sans-serif; } Create scatter, line, polygon, quiver, comet, and stem plots Annotate your map with a scale ruler, north arrow, contour labels, and legends Customize map markers, colors, and line styles Vary transparency for...
Open the catalog to page 4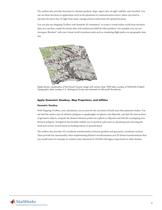
Instrument Control Toolbox table.main {} tr.row {} td.cell {} div.block {} div.paragraph {} .font0 { font:7.00pt "Times New Roman", serif; } .font1 { font:8.00pt "Times New Roman", serif; } .font2 { font:15.00pt "Times New Roman", serif; } .font3 { font:5.00pt "Trebuchet MS", sans-serif; } .font4 { font:7.00pt "Trebuchet MS", sans-serif; } .font5 { font:8.00pt "Trebuchet MS", sans-serif; } .font6 { font:9.00pt "Trebuchet MS", sans-serif; } The toolbox also provides functions to calculate gradient, slope, aspect, line-of-sight visibility, and viewshed. You can use these functions in applications...
Open the catalog to page 5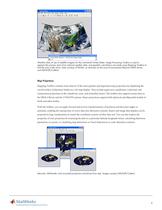
Instrument Control Toolbox table.main {} tr.row {} td.cell {} div.block {} div.paragraph {} .font0 { font:7.00pt "Times New Roman", serif; } .font1 { font:8.00pt "Times New Roman", serif; } .font2 { font:15.00pt "Times New Roman", serif; } .font3 { font:5.00pt "Trebuchet MS", sans-serif; } .font4 { font:7.00pt "Trebuchet MS", sans-serif; } .font5 { font:8.00pt "Trebuchet MS", sans-serif; } Weather data on top of satellite imagery for the continental United States. Image Processing Toolbox is used to segment the primary storm from national weather data, and geodetic calculations are made using...
Open the catalog to page 6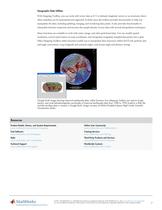
Instrument Control Toolbox table.main {} tr.row {} td.cell {} div.block {} div.paragraph {} .font0 { font:8.00pt "Times New Roman", serif; } .font1 { font:15.00pt "Times New Roman", serif; } .font2 { font:5.00pt "Trebuchet MS", sans-serif; } .font3 { font:6.00pt "Trebuchet MS", sans-serif; } .font4 { font:7.00pt "Trebuchet MS", sans-serif; } .font5 { font:8.00pt "Trebuchet MS", sans-serif; } .font6 { font:10.00pt "Trebuchet MS", sans-serif; } Gographie Data Utilities With Mapping Toolbox, you can work with vector data as X-Y or latitude-longitude vectors or as structures where other metadata...
Open the catalog to page 7All The MathWorks catalogs and technical brochures
 MATLAB Production Server
6 Pages
 Database Toolbox
4 Pages
 MATLAB Report Generator
4 Pages
 Stateflow
8 Pages
 SimEvents
7 Pages
 SimDriveline
7 Pages
 SimHydraulics
7 Pages
 SimPowerSystems
8 Pages
 Simulink Control Design
5 Pages
 Aerospace Blockset
5 Pages
 SimRF
SimRF6 Pages
 Simulink Coder
6 Pages
 Embedded Coder
8 Pages
 Simulink PLC Coder
4 Pages
 Fixed-Point Designer
9 Pages
 MATLAB Coder
5 Pages
 Simulink 3D Animation
10 Pages
 Gauges Blockset
2 Pages
 Simulink Report Generator
3 Pages
 Polyspace Bug Finder
6 Pages
 global-optimization-toolbox
10 Pages
 Phased Array System Toolbox
9 Pages
 OPC Toolbox
5 Pages
 Simulink Design Verifier
7 Pages
 Simulink Design Optimization
10 Pages
 Filter Design HDL Coder
5 Pages
 Bioinformatics Toolbox
9 Pages
 SimBiology
6 Pages
 Computer Vision System Toolbox
10 Pages
 DSP System Toolbox
11 Pages
 Fuzzy Logic Toolbox
5 Pages
 Polyspace Client for C/C++
5 Pages
 xPC Target
5 Pages
 SimMechanics
7 Pages
 Simscape
7 Pages
 Simulink
6 Pages
 Data Acquisition Toolbox
8 Pages
 Image Processing Toolbox
7 Pages
 Signal Processing Toolbox
10 Pages
 Control System Toolbox
6 Pages
 Symbolic Math Toolbox?
6 Pages
 Parallel Computing Toolbox?
7 Pages
 MATLAB®
6 Pages
 Instrument Control Toolbox
7 Pages
 Optimization Toolbox 6.0
14 Pages



Archived catalogs
 MATLAB Release Notes
505 Pages
 C and Fortran API Reference
263 Pages
 External Interfaces
649 Pages
 Function Reference: Volume 3 (P-Z)
1696 Pages
 Function Reference: Volume 2 (F-O)
1568 Pages
 Function Reference: Volume 1 (A-E)
1298 Pages
 Creating Graphical User Interfaces
520 Pages
 3-D Visualization
212 Pages
 Graphics
667 Pages
 MATLAB Programming Tips
66 Pages
 Programming Fundamentals
840 Pages
 Data Analysis
220 Pages
 Mathematics
316 Pages
 MATLAB® Getting Started Guide
250 Pages


- Automation software solution
- Management software solution
- Analysis software solution
- Process software
- Real-time software
- Windows software
- Computer-aided design software
- Cloud-based software
- Control software
- Design software solution
- 3D software solution
- Measurement software
- Visualization software solution
- Simulation software solution
- Programming software solution
- Automated software
- Network software
- Reporting software
- Engineering software
- Machine software