- Catalogs
- The MathWorks
- Graphics
Graphics
1 /667Pages

Graphics
1 /667Pages
Catalog excerpts
7-21 ExportingtotheWindows > orMacintosh > ή Clipboard >
Open the catalog to page 12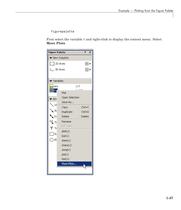
ExamplePlottingfromtheFigurePalette figurepalette Firstselectthevariable > t andright-clicktodisplaythecontextmenu.Select MorePlots . >
Open the catalog to page 67
PlotsandPlottingTools Thedatasourcefor > h(2) is > z(:,2) . > ... Thedatasourcefor > h(n) is > z(:,n) . >
Open the catalog to page 72
BasicPlottingCommands See > LineSpec foradditionallineproperties. >
Open the catalog to page 220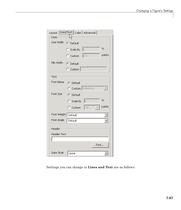
ChangingaFiguresSettings Settingsyoucanchangein LinesandText areasfollows: >
Open the catalog to page 423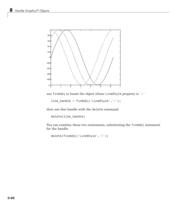
HandleGraphics Objects
Open the catalog to page 530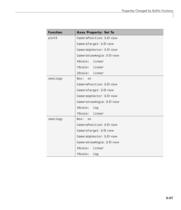
XScale:linearYScale:linear ZScale:linear semilogxBox:onCameraPosition > XScale:log YScale:linear semilogyBox:onCameraPosition >
Open the catalog to page 549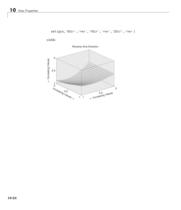
Reverse Axis Direction 0.5 > Increasing Values ← 1 > Increasing Values 0.5 0.5 > → 1 1 > ← Increasing Values
Open the catalog to page 634All The MathWorks catalogs and technical brochures
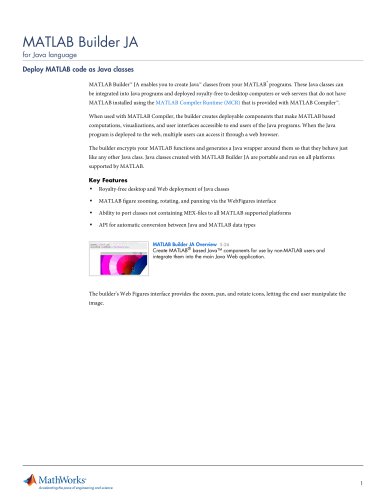
 MATLAB Production Server
6 Pages
 Database Toolbox
4 Pages
 MATLAB Report Generator
4 Pages
 Stateflow
8 Pages
 SimEvents
7 Pages
 SimDriveline
7 Pages
 SimHydraulics
7 Pages
 SimPowerSystems
8 Pages
 Simulink Control Design
5 Pages
 Aerospace Blockset
5 Pages
 SimRF
SimRF6 Pages
 Simulink Coder
6 Pages
 Embedded Coder
8 Pages
 Simulink PLC Coder
4 Pages
 Fixed-Point Designer
9 Pages
 MATLAB Coder
5 Pages
 Simulink 3D Animation
10 Pages
 Gauges Blockset
2 Pages
 Simulink Report Generator
3 Pages
 Polyspace Bug Finder
6 Pages
 global-optimization-toolbox
10 Pages
 Phased Array System Toolbox
9 Pages
 OPC Toolbox
5 Pages
 Simulink Design Verifier
7 Pages
 Simulink Design Optimization
10 Pages
 Filter Design HDL Coder
5 Pages
 Bioinformatics Toolbox
9 Pages
 SimBiology
6 Pages
 Computer Vision System Toolbox
10 Pages
 DSP System Toolbox
11 Pages
 Fuzzy Logic Toolbox
5 Pages
 Polyspace Client for C/C++
5 Pages
 xPC Target
5 Pages
 SimMechanics
7 Pages
 Simscape
7 Pages
 Simulink
6 Pages
 Data Acquisition Toolbox
8 Pages
 Image Processing Toolbox
7 Pages
 Signal Processing Toolbox
10 Pages
 Control System Toolbox
6 Pages
 Symbolic Math Toolbox?
6 Pages
 Parallel Computing Toolbox?
7 Pages
 MATLAB®
6 Pages
 Mapping Toolbox 3.2
7 Pages
 Instrument Control Toolbox
7 Pages
 Optimization Toolbox 6.0
14 Pages


Archived catalogs
 MATLAB Release Notes
505 Pages
 C and Fortran API Reference
263 Pages
 External Interfaces
649 Pages
 Function Reference: Volume 3 (P-Z)
1696 Pages
 Function Reference: Volume 2 (F-O)
1568 Pages
 Function Reference: Volume 1 (A-E)
1298 Pages
 Creating Graphical User Interfaces
520 Pages
 3-D Visualization
212 Pages
 MATLAB Programming Tips
66 Pages
 Programming Fundamentals
840 Pages
 Data Analysis
220 Pages
 Mathematics
316 Pages
 MATLAB® Getting Started Guide
250 Pages


- ERLO management software
- Automation software solution
- Analysis software solution
- Process software
- ERLO Windows software
- Real-time software
- Computer-aided design software
- Cloud-based software
- Control software
- Design software solution
- 3D software solution
- ERLO measurement software
- Visualization software solution
- Simulation software solution
- Automated software
- Programming software
- Network software
- Reporting software
- Engineering software
- Machine software