- Catalogs
- The MathWorks
- Bioinformatics Toolbox
Bioinformatics Toolbox
1 /9Pages

Bioinformatics Toolbox
1 /9Pages
Catalog excerpts
Bioinformatics Toolbox Read, analyze, and visualize genomic and proteomic data Bioinformatics Toolbox™ provides algorithms and visualization techniques for Next Generation Sequencing (NGS), microarray analysis, mass spectrometry, and gene ontology. Using toolbox functions, you can read genomic and proteomic data from standard file formats such as SAM, FASTA, CEL, and CDF, as well as from online databases such as the NCBI Gene Expression Omnibus and GenBank®. You can explore and visualize this data with sequence browsers, spatial heatmaps, and clustergrams. The toolbox also provides statistical techniques for detecting peaks, imputing values for missing data, and selecting features. You can combine toolbox functions to support common bioinformatics workflows. You can use ChIP-Seq data to identify transcription factors; analyze RNA-Seq data to identify differentially expressed genes; identify copy number variants and SNPs in microarray data; and classify protein profiles using mass spectrometry data. Learn more about computational biology. Key Features ▪ Next Generation Sequencing analysis and browser ▪ Sequence analysis and visualization, including pairwise and multiple sequence alignment and peak detection ▪ Microarray data analysis, including reading, filtering, normalizing, and visualization ▪ Mass spectrometry analysis, including preprocessing, classification, and marker identification ▪ Phylogenetic tree analysis ▪ Graph theory functions, including interaction maps, hierarchy plots, and pathways ▪ Data import from genomic, proteomic, and gene expression files, including SAM, FASTA, CEL, and CDF, and from databases such as NCBI and GenBank What additional features would you like in Bioinformatics Toolbox?
Open the catalog to page 1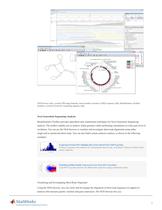
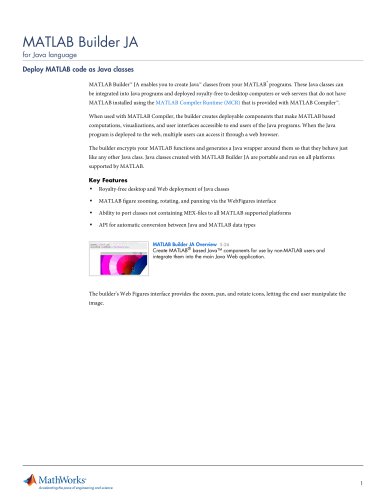
NGS browser (top), circular DNA map (bottom), and secondary structure of RNA sequence (left). Bioinformatics Toolbox includes a variety of tools for visualizing sequence data. Next Generation Sequencing Analysis Bioinformatics Toolbox provides algorithms and visualization techniques for Next Generation Sequencing analysis. The toolbox enables you to analyze whole genomes while performing calculations at a base pair level of resolution. You can use the NGS browser to visualize and investigate short-read alignments using either single-end or paired-end short reads. You can also build custom analysis...
Open the catalog to page 2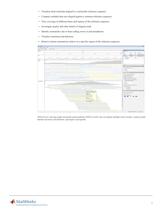
■ Visualize short-read data aligned to a nucleotide reference sequence ■ Compare multiple data sets aligned against a common reference sequence ■ View coverage of different bases and regions of the reference sequence ■ Investigate quality and other details of aligned reads ■ Identify mismatches due to base-calling errors or polymorphisms ■ Visualize insertions and deletions ■ Retrieve feature annotations relative to a specific region of the reference sequence NGS browser, showing single nucleotide polymorphisms (SNPs) in bold. You can display multiple tracks of data, examine peaks, identify insertions...
Open the catalog to page 3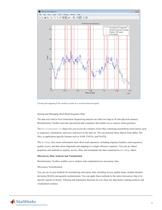
Custom plot mapping E-box motifs to peaks in a wavelet denoised signal. Storing and Managing Short-Read Sequence Data The data sets used in Next Generation Sequencing analysis are often too large to fit into physical memory. Bioinformatics Toolbox provides specialized data containers that enable you to analyze entire genomes. The BioIndexedFile object lets you access the contents of text files containing nonuniform-sized entries such as sequences, annotations, and cross references to the data set. You can generate these objects from tables, flat files, or application-specific formats such as...
Open the catalog to page 4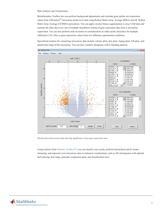
Data Analysis and Visualization Bioinformatics Toolbox lets you perform background adjustments and calculate gene (probe set) expression values from Affymetrix microarray probe-level data using Robust Multi-Array Average (RMA) and GC Robust Multi-Array Average (GCRMA) procedures. You can apply circular binary segmentation to array CGH data and estimate the false discovery rate of multiple hypotheses testing of gene expression data from a microarray experiment. You can also perform rank-invariant set normalization on either probe intensities for multiple Affymetrix CEL files or gene expression...
Open the catalog to page 5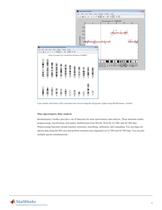
BJ Copy Number Variation File b d it View Iniert Tools Of: Hep Window Help Q Human Karyogram with Copy Number AbreraborK Fh Edi1 V"«w Inwrt Iwli Otsktsp Human Karyngram wilh Copy Number Alterations of GMQ5G79 Copy number alterations (left) calculated and viewed alongside ideograms (right) using Bioinformatics Toolbox. Mass Spectrometry Data Analysis Bioinformatics Toolbox provides a set of functions for mass spectrometry data analysis. These functions enable preprocessing, classification, and marker identification from SELDI, MALDI, LC/MS, and GC/MS data. Preprocessing functions include baseline...
Open the catalog to page 6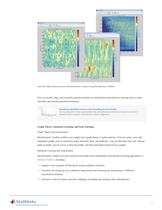
Label-free differential proteomics and metabolomics analysis using Bioinformatics Toolbox. You can smooth, align, and normalize spectra and then use classification and statistical learning tools to create classifiers and identify potential biomarkers. '* Identifying Significant Features and Classifying Protein Profiles * See classification of mass spectrometry data and statistical tools that can be used to look for ll, 1, ..., I potential disease markers and proteomic pattern diagnostics. Graph Theory, Statistical Learning, and Gene Ontology Graph Theory and Visualization Bioinformatics Toolbox...
Open the catalog to page 7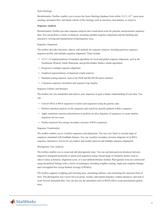
Gene Ontology Bioinformatics Toolbox enables you to access the Gene Ontology database from within MATLAB®, parse gene ontology annotated files, and obtain subsets of the ontology such as ancestors, descendants, or relatives. Sequence Analysis Bioinformatics Toolbox provides sequence analysis and visualization tools for genomic and proteomic sequence data. You can perform a variety of analyses, including multiple sequence alignments and the building and interactive viewing and manipulation of phylogenetic trees. Sequence Alignment The toolbox provides functions, objects, and methods for sequence...
Open the catalog to page 8
Protein Feature Analysis The toolbox provides protein sequence analysis techniques, including routines for calculating properties of a peptide sequence such as atomic composition, isoelectric point, and molecular weight. You can determine the amino acid composition of protein sequences, cleave a protein with an enzyme, and create backbone plots and Ramachandran plots of PDB data. You can use the Sequence Tool to view the properties of an amino acid sequence or use the Molecule Viewer to display and manipulate 3D molecular structures. Data Import and Application Deployment File Formats and Database...
Open the catalog to page 9All The MathWorks catalogs and technical brochures
 MATLAB Production Server
6 Pages
 Database Toolbox
4 Pages
 MATLAB Report Generator
4 Pages
 Stateflow
8 Pages
 SimEvents
7 Pages
 SimDriveline
7 Pages
 SimHydraulics
7 Pages
 SimPowerSystems
8 Pages
 Simulink Control Design
5 Pages
 Aerospace Blockset
5 Pages
 SimRF
SimRF6 Pages
 Simulink Coder
6 Pages
 Embedded Coder
8 Pages
 Simulink PLC Coder
4 Pages
 Fixed-Point Designer
9 Pages
 MATLAB Coder
5 Pages
 Simulink 3D Animation
10 Pages
 Gauges Blockset
2 Pages
 Simulink Report Generator
3 Pages
 Polyspace Bug Finder
6 Pages
 global-optimization-toolbox
10 Pages
 Phased Array System Toolbox
9 Pages
 OPC Toolbox
5 Pages
 Simulink Design Verifier
7 Pages
 Simulink Design Optimization
10 Pages
 Filter Design HDL Coder
5 Pages
 SimBiology
6 Pages
 Computer Vision System Toolbox
10 Pages
 DSP System Toolbox
11 Pages
 Fuzzy Logic Toolbox
5 Pages
 Polyspace Client for C/C++
5 Pages
 xPC Target
5 Pages
 SimMechanics
7 Pages
 Simscape
7 Pages
 Simulink
6 Pages
 Data Acquisition Toolbox
8 Pages
 Image Processing Toolbox
7 Pages
 Signal Processing Toolbox
10 Pages
 Control System Toolbox
6 Pages
 Symbolic Math Toolbox?
6 Pages
 Parallel Computing Toolbox?
7 Pages
 MATLAB®
6 Pages
 Mapping Toolbox 3.2
7 Pages
 Instrument Control Toolbox
7 Pages
 Optimization Toolbox 6.0
14 Pages


Archived catalogs
 MATLAB Release Notes
505 Pages
 C and Fortran API Reference
263 Pages
 External Interfaces
649 Pages
 Function Reference: Volume 3 (P-Z)
1696 Pages
 Function Reference: Volume 2 (F-O)
1568 Pages
 Function Reference: Volume 1 (A-E)
1298 Pages
 Creating Graphical User Interfaces
520 Pages
 3-D Visualization
212 Pages
 Graphics
667 Pages
 MATLAB Programming Tips
66 Pages
 Programming Fundamentals
840 Pages
 Data Analysis
220 Pages
 Mathematics
316 Pages
 MATLAB® Getting Started Guide
250 Pages


- ERLO management software
- Automation software solution
- Analysis software solution
- Process software
- ERLO Windows software
- Real-time software
- Computer-aided design software
- Cloud-based software
- Control software
- Design software solution
- 3D software solution
- ERLO measurement software
- Visualization software solution
- Simulation software solution
- Automated software
- Programming software
- Network software
- Reporting software
- Engineering software
- Machine software