- Catalogs
- Kyowa Europe GmbH PULSEROLLER
- NETWORK MONITOR
NETWORK MONITOR
1 /9Pages
NETWORK MONITOR
1 /9Pages
Catalog excerpts

ConveyLinx module firmware and functionality is protected by U.S. and international patents. For complete patent information visit www.oulseroller. com/oatents
Open the catalog to page 1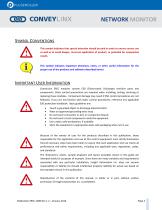
This symbol indicates that special attention should be paid in order to ensure correct use as well as to avoid danger, incorrect application of product, or potential for unexpected results This symbol indicates important directions, notes, or other useful information for the proper use of the products and software described herein. ConveyLinx ERSC modules contain ESD (Electrostatic Discharge) sensitive parts and components. Static control precautions are required when installing, testing, servicing or replacing these modules. Component damage may result if ESD control procedures are not followed....
Open the catalog to page 2
NETWORK MONITOR Summary of Changes The following table summarizes the changes and updates made to this document since the last revision Global Contact Information PULSEROLLER WWW.PULSEROLLER.COM
Open the catalog to page 3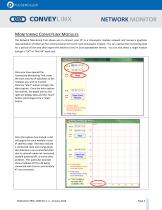
NETWORK MONITOR MONITORING CONVEYLINX MODULES The Network Monitoring Tool allows you to connect your PC to a ConveyLinx module network and receive a graphical representation of Ethernet Port communication errors for each ConveyLinx module. You can capture the monitoring data for a period of time and then export the details to view in Excel spreadsheet format. You can also select a single module and get a “OK” or “Not OK” quick test. Once you have opened the ConveyLinx Monitoring Tool, enter the start and end IP addresses of the modules you wish to monitor. Click the “Start” button to begin the...
Open the catalog to page 4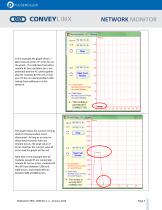
frS Module Monitor 1.2.0 - Working In this example the graph shows 7 black dots all at the "0" error line on the graph. This indicates that either module #1 has a problem (or is not powered) and the PC cannot gather data for modules #2 thru #7 or that your PC has an overall problem with seeing these addresses on the network. The graph shows the current running total of communication errors discovered. As long as no reset or disconnet/reconnect with any module occurs, the peak value of errors matches the current value of errors and the graph will be red. Note that in this example that all modules...
Open the catalog to page 5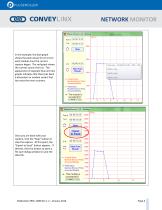
In this example, the blue graph shows the peak values for errors for each module since the current capture began. The red graph shows the current count of errors. The appearance of separate blue and red graphs indicates that there has been a disconnect or module restart that has reset the error counters. Once you are done with your capture, click the "Stop" button to stop the capture. At this point, the "Export to Excel" button appears. If desired, click this button to open a file save dialog window to save the data file.
Open the catalog to page 6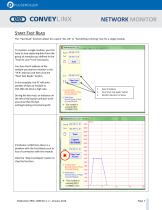
NETWORK MONITOR START FAST READ The “Fast Read” function allows for a quick “ALL OK” or “Something is Wrong” test for a single module. To monitor a single module; you first have to stop capturing data from the group of modules you defined in the “From #” and “To #” text boxes. You then the IP address of the module you want to monitor in the “IP #” text box and then click the “Start Fast Reads” button. In this example, the PC will send packets of data to module at 192.168.112.20 at a high rate. During the fast read, an indicator on the left of the button will spin to let you know that the fast...
Open the catalog to page 7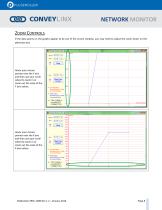
NETWORK MONITORZoom Controls If the data points on the graphs appear to be out of the screen window, you may need to adjust the zoom factor on the particular axis. Hover your mouse pointer over the Y axis and then use your scroll wheel to zoom in or zoom out the scale of the Y axis values. Hover your mouse pointer over the X axis and then use your scroll wheel to zoom in or zoom out the scale of the X axis values.
Open the catalog to page 8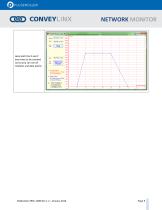
NETWORK MONITOR Here both the X and Y axes have to be zoomed out so you can see all modules and data points.
Open the catalog to page 9All Kyowa Europe GmbH PULSEROLLER catalogs and technical brochures
 EZ-QUBE-W-Ai 24V
2 Pages
 PGD-Ai 48V
4 Pages
 Pallet-Ai 24V
4 Pages
 Senergy-Ai 24V
4 Pages
- Electric gearmotor
- Digital I/O
- Cloud-based software
- IO module
- Digital IO module
- Visualization software solution
- Industrial electric gearmotor
- Motor controller
- 24 V gear-motor
- AC gear-motor
- Compact gear-motor
- Gear train gearmotor
- Network software
- Parallel-shaft electric gearmotor
- Creation software
- DC motor controller
- BLDC gear-motor
- Ethernet IO module
- Configurable IO module
- Two-stage gear-motor