 Website:
KRÜSS GmbH
Group: Krüss
Catalog excerpts

Technical Note Pendant Drop Measurements Technical note: Industry section: Drop Shape Analyzer – DSA100 Method: Keywords: Drop Shape Analyzer – DSA30 Methods, surface tension, interfacial tension, pendant drop Determining the surface tension of liquids by measurements on pendant drops Introduction Among the numerous measuring methods for surface and interfacial tension between fluids, the optical pendant drop method is particularly elegant: It requires only a very small sample volume, not much apparatus, has few limiting conditions and is, when used correctly, a very accurate method. This article is intended to place current and future users of this method in the position of being able to achieve reliable results rapidly. KRÜSS customers with DSA100, DSA30 instruments and most of the EasyDrop versions already have access to this method with the help of a software module and minimal additional equipment. Background The pendant drop (PD) method is an optical method for determining the surface or interfacial tension of a drop of liquid by using the curvature of the drop profile. An advantage when compared with the frequently used methods based on force measurement, such as the Du Noüy ring measurement or the Wilhelmy plate measurement, is the very small sample volume required (approx. 20-60 µL). In addition, measurements are possible throughout a wide pressure and temperature range (up to 690 bars and up to 400°C with KRÜSS equipment). Users of KRÜSS laboratory contact angle measuring instruments can utilize the method to evaluate the quality of the test liquids with very little effort by checking their surface tension values. The main purpose of this article is to indicate the parameters that influence the accuracy of a PD measurement in order to place the user in a position of being able to avoid errors and obtain a reliable result. Measuring principle At the tip of a needle a suspended drop of a specifically heavier liquid generated within a specifically lighter phase (Fig. 1A). The lighter phase is either air (surface tension measurements) or another liquid (interfacial tension measurements). KRÜSS GmbH | Borsteler Chaussee 85 | 22453 Hamburg | Germany | www.kruss.d
Open the catalog to page 1
During a measurement the magnification of the video image is first determined in order to be able to access the actual drop dimensions. The drop shape is then determined from the video image of the generated drop by gray level analysis. A numerical method is then used to vary a shape parameter known as B until the calculated drop shape coincides with the actual drop shape. The interfacial tension σ is then calculated from the difference in density ∆ρ and the adapted B parameter. Fig. 1: Pendant drop (A); curved surface segment (B), the radii of the horizontal (green) and vertical (blue)...
Open the catalog to page 2
The outer diameter of the needle seen on the screen is normally used as the reference size. This diameter should be determined with an accuracy of at least 10 µm in the lower section of the needle used for determining the magnification in order to eliminate any possible heightdependent diameter variations. The tool used, for example an external micrometer, should be positioned so that the diameter is measured at right angles to the optical axis. In this way errors due to possible variation of the needle profile from a true circle can be eliminated. The capillary tip must be located...
Open the catalog to page 3
1.5 Excluding evaporation effects Fig. 6: Correct (A) and incorrect (B) focus setting. The brightness of the background illumination should also be optimized. If the light intensity is too dark then the contrast between the background and the drop will also be too weak; this means that profile recognition by the software will be incorrect or even impossible. In contrast, too bright background illumination can lead to over-illumination of the drop, which then appears narrower than it actually is. Fig. 7 shows the influence of the illumination on the contrast between the drop and background....
Open the catalog to page 4
2.2 Sensibility of profile recognition in the analysis software The sensitivity of the profile recognition is expressed by the determined difference in gray levels that is considered as the transition between the drop and the surrounding phase. For sharp drop images with a good contrast a value of around 30 is recommended – this is the default setting for “profile detection” in the KRÜSS software. With poorly recognizable phase transitions the value can be reduced. If the sensitivity is set incorrectly then the software cannot determine the drop profile, or cannot determine it correctly...
Open the catalog to page 5All KRÜSS GmbH catalogs and technical brochures
-
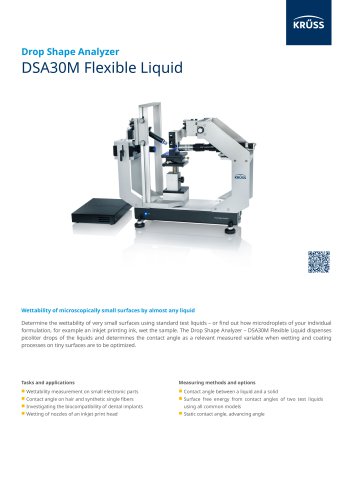
DROP SHAPE ANALYZER – DSA30M
2 Pages
-
DSA30M Flexible Liquid
2 Pages
-
Product Overview 2025
84 Pages
-
Tensíío
2 Pages
-
Ayríís
2 Pages
-
FORCE TENSIOMETER – K20
2 Pages
-
FORCE TENSIOMETER – K6
1 Pages
-
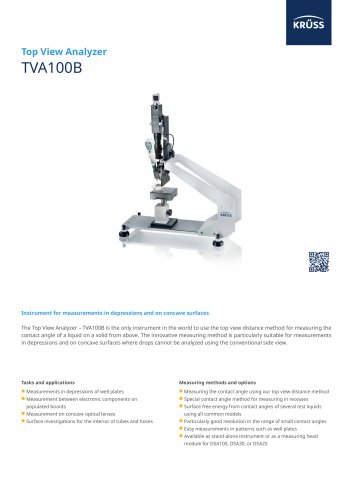
TOP VIEW ANALYZER – TVA100B
2 Pages
-
DROP SHAPE ANALYZER – DSA30
2 Pages
-
DROP SHAPE ANALYZER – DSA30R
2 Pages
-
Drop Shape Analyzer DSA25
2 Pages
-
DROP SHAPE ANALYZER – DSA100
2 Pages
-
Dynamic Foam Analyzer DFA100
2 Pages
-
DSA100, DSA30
4 Pages
-
DSA100
3 Pages


