
Catalog excerpts

Agilent N4391A Optical Modulation Analyzer Measure with confidence Get insight into amplitude, phase and polarization modulated optical signais Data Sheet Օ Agilent Technologies
Open the catalog to page 1
Introduction The N439IA optical modulation analyzer is a universal tool for anyone who need to quantify the integrity of vector modulated signais in digital high speed optical transmission for 100G and beyond. The N4391A optical modulation analyzer is based on the same architecture as proposed for 100G cohrent transmission by the Optical Internetworking Forum (01F). Therefore it is based on cohrent polarization-diverse d驩tection with real-time data acquisition to provide optimal phase tracking of the measured signal. The N4391A analysis software is based on the 89600 Vector Signal Analysis...
Open the catalog to page 2
Application Transmitter Test Transmitter signal integrity characterization fvs>~ Transmitter performance vrification Transmitter optimal alignment during manufacturing Transmittervendor qualification Final pass fail test in manufacturing Evaluation of transmitter components for best signal fidelity ------- >v\\ ,.\\W m r> rli iln Irir 4%j Transmitter laser Beam s p line \ modulator A k Y-plane J modulator Polarization combiner Signal input Figure 2. Homodyne component characterization Component valuation independent of carrier laser phase noise Modulator in System qualification...
Open the catalog to page 3
Application link test Transmitter (vector modulated) .- v - ____* ΏM lapaind Figure 5. Link qualification New tools al low optical links to be characterized by measuring the link impairments on the vector modulated signal. Research engineers and scientists, who are interested in characterization of the performance of an optical I in k, now get the tools at hand to characterize vector modulated signais along the link down to the receiver. Tools for link test CD compensation In-channel CD measurement PMD compensation In-channel I-st order PMD measurement Trigger mode (gating) for loop...
Open the catalog to page 4
Application algorithm development Signal Cohrent i electro-optical receiver adc user carrier recoverv algorithm resampling and/or equalization Agilent analysis tools algorithm display adc Frontend correction deskewing +\ adc ^ rf驩rence receiver user algorithm final processing/UI Figure 7. Principle of signal flowofthe N4391A with rfrence receiver preprocessing, finalprocessing, decoding and display User algorithm int驩gration Being able to work with a well defined and specified rfrence System will speed up the development process of a coh驩rent receiver signfica nlly and leadsto additional...
Open the catalog to page 5
Constellation and Eye Diagram Analysis Optical 1-0 diagram The l-Q diagram (also called a polar or vector diagram) displays demodulated data traced as the in-phase signal (I) on the x-axis versus the quadrature-phase signal (Q) on the y-axis. This tool gives deeper insight into the transition behavior of the signal, show-ing overshootand an indication of whether the signal is bandwidth limited when a transition is not close to a straight line. "taure 10. A: C-iC2DGPSI;Mci8lm Optical constellation diagram In a constellation diagram, information is shown only at specified time intervais. The...
Open the catalog to page 6
Signal Integrity and Bit Error Analysis Tools Error vector magnitude The error vector time trace shows computed error vector between correspondis symbol points in the l-Q measured and l-Q rͩfrence signais. The data can be displayed as error vector magnitude, error vector phase, only the I component or only the Q component. This tool gives a quick visual indication of how the signal matches the idal signal. Figure 14 [Q magnitude error EVM |n] = VT err [n]' + Q err |n); Where [n] = measurement at the symbol tinte I g» = I r驩frence - I measurement Q err = Q rf驩rence - O measurement Oerr 0 =...
Open the catalog to page 7
Spectral Analysis and Transmitter Laser Characterization Narrow-band, high-resolution spectrum The narrow-band high resolution spectrum displays the Fourier-transformed spectrum of the time-domain signal. The center-frequency corresponds to the local oscillator frequency. as entered in the user interface. This tool gives a quick overview of the spectrum of the analyzed signal and the resulting requirements on channel width in the transmission System. The spectrogram shows the volution of the spectrum over time, offering the option to monitor drifts ofthe carrier laser (see Figure 17)....
Open the catalog to page 8
Symbol Polarization Display With real-time polarization-diverse dtection, ail information of the incoming electromagnetic field is available from the instrument The sampled signal is displayed as a blue dot in the Stokes space. The example on the right side shows the typical distribution of a polarization multiplexed incoming signal with QPSK modulation. This display shows the distribution of the symbols and the transition on the Stokes space and supports signal integrity test at each point in the optical link from transmitter to receiver. Figure 21 36 Modulation Formats incluclecl D8PSK...
Open the catalog to page 9
N4391A Theory of Opration Block Diagram X-polarization optical front-end control software LO out Si y n a Figure 25. Block diagram of the optical modulation analyzer 10
Open the catalog to page 10
Theory of Opration The optical modulation analyzer makes use of the most advanced optical dtection technology with a combina-tion of coh驩rent and polarization sensitive dtection. The core building blocks are: 1. The optical polarization-diverse cohrent receiver 2. The data acquisition unit 3. Polarization alignment 4. The 39600 vector signal analyzer software Optical polarization-diverse coh驩rent dtection The input signal provided to the receiver is split into x and y polarization planes and fed into an optical l-Q mixer (optical hybrid), for each polarization plane. The optical local...
Open the catalog to page 11
the demodulator to lock to the signal and tecovet the symbols. The VSA receives two independent 1-0 data stteams from the digital polarization processing stage. The demodulator uses the selected center frequency and symbol rate to lock to the carrier and recover the symbol dock from the modulated carrier. Note that the demodulator rfrence dock does not need to be locked wtth the source clock. The demodulator automatically provides carrier and symbol lock; there is no need to supply an externat source clock. The signal then goes through a compensation processthat applies gain and phase...
Open the catalog to page 12All KEYSIGHT TECHNOLOGIES catalogs and technical brochures
-
 Network Visibility Products
24 Pages
-
 RF Products
20 Pages
-
 Basic Instruments
34 Pages
-
 InfiniiVision 2000 X-Series
31 Pages
-
 Signal Analyzers X-Series
21 Pages
-
 KeysightCare
8 Pages
-
 FieldFox and Nemo Handy
4 Pages
-
 Impedance and Network Analysis
42 Pages
-
 E4990A Impedance Analyzer
12 Pages
-
 Keysight N6780 Series
10 Pages
-
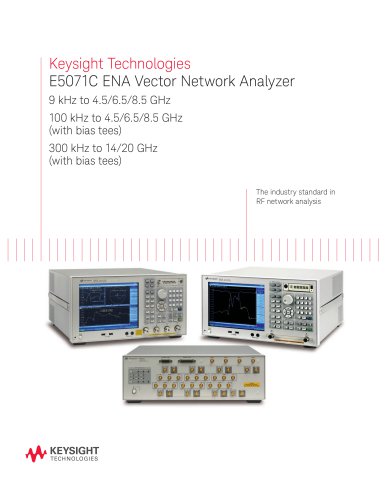 E5071C ENA Network Analyzers
18 Pages
-
 Keysight Process Analysis
7 Pages
-
 BenchVue Software
2 Pages
-
 Keysight Process Analysis
7 Pages
-
 PXI RF Switch Modules
2 Pages
-
 I/O Hardware
18 Pages
-
 Digital Multimeters
28 Pages
-
 Data Acquisition - DAQ
32 Pages
-
 PCIe Digitizers
8 Pages
-
 2015 Optical Component Test
40 Pages
-
 Power Products Catalog
215 Pages
-
 N9000A CXA Signal Analyzer
2 Pages
-
 Agilent 89600 VSA Software
8 Pages
-
 X-Series
23 Pages
-
 CXA X-Series
8 Pages
-
 SOLUTION BROCHURE
6 Pages
-
 Waveguide Power Sensors
2 Pages
-
 Power Meters and Power Sensors
34 Pages
-
 E7515A UXM Wireless Test Set
2 Pages
-
 E5063A Network Analyzer
8 Pages
-
 N9320B RF Spectrum Analyzer
12 Pages
-
 E5052B Signal Source Analyzer
21 Pages
-
 N9038A MXE EMI Receiver
22 Pages
-
 RDX Test Solutions for DigRF
17 Pages
-
 M9252A DigRF Host Adapter
2 Pages
-
 M9502A and M9505A
12 Pages
-
 Oscilloscopes
16 Pages
-
 Agilent Power Products
31 Pages
-
 LIGHTWAVE CATALOG VOLUME I 2013
40 Pages
-
 U4301A PCIe Analyzer
7 Pages
-
 N9030A PXA Signal Analyzer
32 Pages


Archived catalogs
-
 Agilent Technologies - Catalog
40 Pages