Lightwave Catalog: Optical-Electrical/Polarization/Complex Modulation Analysis 2013 Vol 2
1 /
40Pages

Catalog excerpts

LIGHTWAVE CATALOG Optical-Electrical/Polarization/Complex Modulation Analysis
Open the catalog to page 1
Agilent Technologies Lightwave Catalog 2013 Since more than 30 years, Agilent offers high-performance solutions to support you in building the high-speed communication network. Your experience and feedback helped us to continuously improve the product performance and quality, while significantly reducing the cost, especially when it comes to manufacturing optical components. Your needs and my confidence into our quality let me now offer our products with a 3-year warranty that's standard on all instruments, worldwide. This combination of reliability and coverage brings you three key...
Open the catalog to page 2
Understand the real nature of complex modulated signals The new Agilent N4392A optical modulation analyzer (OMA) lets you see the true nature of complex modulated signals. Powered by the Agilent 89600 vector signal analysis software, you get deeper analysis and greater flexibility. At a fraction of the cost, size and weight of a typical OMA, you can N4392A optical modulation anal Compact, portable and affordable 32 Gbaud symbol rate 63 GSa/s sample rate Agilent Technologies
Open the catalog to page 3
Optical Modulation Analysis Tools The l-Q diagram (also called a polar or vector diagram) displays de- modulated data, traced as the in-phase signal (I) on the x-axis versus the quadrature-phase signal (Q) on the y-axis. This tool gives deeper insight into the transition behavior of the signal, showing overshoot and an indication of whether the signal is bandwidth limited when a transition is not close to a straight line. Optical constellation diagram In a constellation diagram information is shown in a two-dimensional polar diagram, displaying amplitude and phase of the signal. The...
Open the catalog to page 5
Applications Optical Modulation Analysis Tools www.agilent.com/find/oma Error vector magnitude Error vector limit test The error vector time trace shows computed error vector between measured I-Q points and the reference I-Q points. The data can be displayed as error vector magnitude, error vector phase, the I component only or the Q component only. The error vector concept is a very powerful way to qualify the overall performance of an complex modulated signal. Testing against a limit with pass/fail indication covers all typical error sources that could occur during transmitter...
Open the catalog to page 6
Applications Coherent Transmitter and Modulator Test www.agilent.com/find/n4392a Transmitter laser Transmitter signal integrity characterization • Transmitter signal performance verification • Verify optimal alignment biasing circuits and skews • Transmitter vendor qualification • Final pass fail test in manufacturing • Evaluation of transmitter components for best signal fidelity Beam splitter X-plane modulator Y-plane modulator Polarization combiner Signal input Transmitter laser Beam splitter X-plane modulator Y-plane modulator Local oscillator input Polarization combiner Signal input...
Open the catalog to page 7
Coherent Transmiiter Test in Manufacturing Optical constellation diagram In a constellation diagram, signal information is shown only at the middle of a symbol time. This represents exactly the time stamp a real receiver will take to decide on the transmitted data. These points are commonly referred to as detec- tion decision-points-, and are interpreted as the digital symbols. Constellation diagrams help identify effects like amplitude imbalance, quadrature error, or phase noise just to mention some of them. For calculating the BER based on statistical data a Gaussian noise distortion is...
Open the catalog to page 8
Advanced research on OFDM OFDM high resolution spectrum An ODFM signal is a set of carriers that are orthogonal and very closely spaced in frequency domain, which lets the spectrum appear rectangular in a perfect signal. In addition a ODFM signal often carries pilot and synchronization information at different power levels. With high resolution spectral display, a quantitative analysis of the OFDM signal can be done in parallel with the other analysis tools.
Open the catalog to page 9
Applications Research on Modulation Formats www.agilent.com/find/n4392a Customer configurable APSK demodulator This new generic decoder allows the user to configure a custom decoding scheme in accordance with the applied IQ signal. Up to 8 amplitude levels can be combined freely with up to 256 phase levels. This provides nearly unlimited freedom in research to define and evaluate the transmission behavior of a proprietary modulation format. The setup is easy and straightforward. Some examples are shown below. Optical duobinary decoder In 40 G transmission systems, an optical duobinary...
Open the catalog to page 10
Impairments in Complex Modulation Transmission To describe the quality of a complex modulated signal, there are a variety of parameters in place. Quad Err = 36 824 rndeg Gain Imb = D 024 dB IQ offset (also called l/Q origin offset) indicates the magnitude of the carrier feed through signal. When there is no carrier feed through, IQ offset is zero (-infinity dB). Magnitude error Magnitude error is the difference in amplitude between the measured signal and the l/Q reference signal. Phase error Phase error is the phase difference between the l/Q reference signal and the l/Q measured signal,...
Open the catalog to page 11
Impairments in Complex Modulation Transmission SNR (MER) - signal to noise ratio (modulation error ratio) SNR (MER) - Signal to Noise Ratio (Modulation Error Ratio) is the signal-to-noise ratio, where signal is the average symbol power of the transmitted waveform. The noise power includes any term that causes the symbol to deviate from its ideal state Note: SNR and 0SNR are only equal in Gaussian noise limited systems, when proper normalization is used (0SNR is typically measured with Error vector and error vector magnitude as a global measure EVM %rms is a normalized measure of all error...
Open the catalog to page 12
Applications Lightwave Component Analysis www.agilent.com/find/lca In digital photonic transmission systems, the performance is ultimately determined by Bit Error Ratio Test (BERT). As this parameter describes the performance of the whole system, it is necessary to design and qualify subcomponents like modulators and PIN detectors, which are analog by nature, with different parameters that reflect their individual performance. O/E characterization The measurement of an electro-optical receiver device consists of the ratio of output electrical modulation current to input optical modulation...
Open the catalog to page 13All KEYSIGHT TECHNOLOGIES catalogs and technical brochures
-
 Network Visibility Products
24 Pages
-
 RF Products
20 Pages
-
 Basic Instruments
34 Pages
-
 InfiniiVision 2000 X-Series
31 Pages
-
 Signal Analyzers X-Series
21 Pages
-
 KeysightCare
8 Pages
-
 FieldFox and Nemo Handy
4 Pages
-
 Impedance and Network Analysis
42 Pages
-
 E4990A Impedance Analyzer
12 Pages
-
 Keysight N6780 Series
10 Pages
-
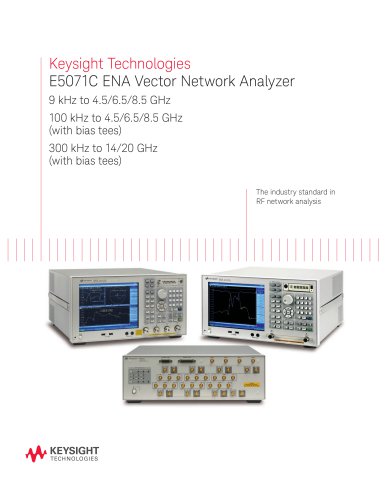 E5071C ENA Network Analyzers
18 Pages
-
 Keysight Process Analysis
7 Pages
-
 BenchVue Software
2 Pages
-
 Keysight Process Analysis
7 Pages
-
 PXI RF Switch Modules
2 Pages
-
 I/O Hardware
18 Pages
-
 Digital Multimeters
28 Pages
-
 Data Acquisition - DAQ
32 Pages
-
 PCIe Digitizers
8 Pages
-
 2015 Optical Component Test
40 Pages
-
 Power Products Catalog
215 Pages
-
 N9000A CXA Signal Analyzer
2 Pages
-
 Agilent 89600 VSA Software
8 Pages
-
 X-Series
23 Pages
-
 CXA X-Series
8 Pages
-
 SOLUTION BROCHURE
6 Pages
-
 Waveguide Power Sensors
2 Pages
-
 Power Meters and Power Sensors
34 Pages
-
 E7515A UXM Wireless Test Set
2 Pages
-
 E5063A Network Analyzer
8 Pages
-
 N9320B RF Spectrum Analyzer
12 Pages
-
 E5052B Signal Source Analyzer
21 Pages
-
 N9038A MXE EMI Receiver
22 Pages
-
 RDX Test Solutions for DigRF
17 Pages
-
 M9252A DigRF Host Adapter
2 Pages
-
 M9502A and M9505A
12 Pages
-
 Oscilloscopes
16 Pages
-
 Agilent Power Products
31 Pages
-
 LIGHTWAVE CATALOG VOLUME I 2013
40 Pages
-
 U4301A PCIe Analyzer
7 Pages
-
 N9030A PXA Signal Analyzer
32 Pages


Archived catalogs
-
 Agilent Technologies - Catalog
40 Pages