TRACEiT®
1 /6Pages

TRACEiT®
1 /6Pages
Catalog excerpts

® TRACEiT 3D Topography Roughness (Ra opt, Rq opt, and Rz opt) Visual Documentation Height Distribution Porosity Distribution Effective Contact Area Innowep GmbH Haugerring 6, Würzburg, Germany 97070
Open the catalog to page 1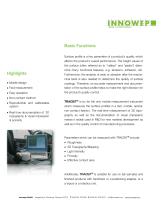
Basic Functions Surface profile is a key parameter of a product’s quality, which affects the product’s overall performance. The height values of the surface (often referred as to “valleys” and “peaks”) determine many functional features, e.g. abrasion, adhesion, etc. Furthermore, the analysis of wear or abrasion after the mechanical tests is also needed to determine the quality of surface • Mobile design • Fast measurement coatings. Therefore, an accurate measurement and documentation of the surface profile helps to make the right decision for • Easy operation the product’s quality control. • Non-contact...
Open the catalog to page 2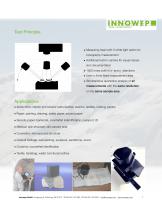
Test Principle • Measuring head with 3 white light optics for topography measurement • Additional built-in camera for visual impression documentation • 1500 times both in x- and y- directions • 5mm x 5mm fixed measurement area • Simultaneous quantative analysis of all measurements with the same resolution on the same sample area Applications • Automotive: interior and exterior parts (leather, plastics, textiles, coating, paints) • Paper: painting, drawing, safety paper, ancient paper • Security paper: banknote, counterfeit indentification, passport, ID • Medical: skin structure, skin cancer, scar...
Open the catalog to page 3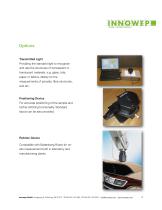
Options Transmitted Light Providing the standard light to recognize and rate the structures of transparent or translucent materials, e.g. glass, foils, paper or fabrics. Mainly for the measurements of porosity, fibre structures, and etc. Positioning Device For accurate positioning of the sample and further stitching functionality. Standard tripod can be also provided. Robotic Device Compatible with Battenberg Robot for onsite measurement both in laboratory and manufacturing plants.
Open the catalog to page 4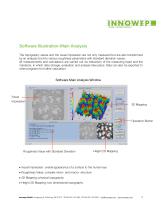
Software Illustration-Main Analysis The topography values and the visual impression are not only measured but are also transformed by an analysis tool into various roughness parameters with standard deviation values. All measurements and calculations are carried out via interaction of the measuring head and the notebook, in which data storage, evaluation and analysis take place. Data can also be exported to other programs for further calculation. Software Main Analysis Window Visual Impression 3D Mapping Operation Button Roughness Value with Standard Deviation • Visual Impression: overall appearance...
Open the catalog to page 5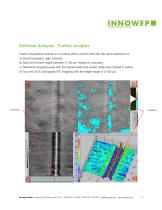
Software Analysis - Further Analysis Direct comparative analysis on a surface after a scratch test with the same resolution of: a) Visual Impression, light intensity; b) Area of the lower height between 0-106 μm marked in turquoise; c) Selected topography area with the highest peak and lowest valley area marked in yellow; d) Top view of 3D topography/3D mapping with the height range of 0-182 μm;
Open the catalog to page 6All INNOWEP catalogs and technical brochures
 ABREX®
5 Pages
 Taperader®
4 Pages
 UST®
UST®10 Pages
 ABREX® Model Options
2 Pages
- Test stand
- Automated test bench
- Automatic tester
- Industrial tester
- Industrial test bench
- Universal testing system
- Surface measuring machine
- Horizontal test bench
- R&D tester
- Compact test station
- Fatigue test bench
- Optical surface measuring machine
- 3D surface profile measuring machine
- Loop tester
- Quality test station
- Abrasion tester
- Non-contact surface measuring machine
- Mechanical test bench
- Benchtop surface measuring machine
- Gearbox test bench