- Catalogs
- Harvard Bioscience, Inc.
- Harvard Apparatus Equilibrium Dialysis Guide
Harvard Apparatus Equilibrium Dialysis Guide
1 /29Pages

Harvard Apparatus Equilibrium Dialysis Guide
1 /29Pages
Catalog excerpts

Guide to Equilibrium Dialysis
Open the catalog to page 2
Introduction Equilibrium Dialysis is a simple but effective tool for the study of interactions between molecules. Whether it be characterization of a candidate drug in serum binding assays or detailed study of antigen-antibody interactions, equilibrium dialysis proves to be the most accurate method available. Equilibrium dialysis is inexpensive and easy to perform, the only instrumentation required is that used to quantify the compound of interest. Since the results of the assay are obtained under equilibrium conditions, the true nature of the interaction can be studied. Equilibrium dialysis...
Open the catalog to page 3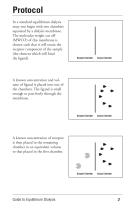
In a standard equilibrium dialysis assay you begin with two chambers separated by a dialysis membrane. (MWCO) of this membrane is chosen such that it will retain the receptor component of the sample (the element which will bind Sample Chamber Assay Chamber ume of ligand is placed into one of the chambers. The ligand is small enough to pass freely through the Sample Chamber Assay Chamber A known concentration of receptor is then placed in the remaining chamber in an equivalent volume to that placed in the first chamber. Sample Chamber Assay Chamber Guide to Equilibrium Dialysis
Open the catalog to page 4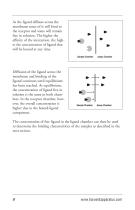
As the ligand diffuses across the membrane some of it will bind to the receptor and some will remain free in solution. The higher the affinity of the interaction, the higher the concentration of ligand that will be bound at any time. Sample Chamber Assay Chamber Diffusion of the ligand across the membrane and binding of the ligand continues until equilibrium has been reached. At equilibrium, the concentration of ligand free in solution is the same in both chambers. In the receptor chamber, however, the overall concentration is higher due to the bound-ligand component. The concentration of free...
Open the catalog to page 5
Data Analysis Equilibrium Dialysis can be used in a wide variety of experiments and the methods used to analyze the resulting data can vary just as widely. This section serves as an introduction to the types of data analysis tools used to interpret experimental data generated using equilibrium dialysis. The type of assay typically performed using equilibrium dialysis falls under the category of saturation binding experiments. In this case the equilibrium binding of various concentrations of the receptor and ligand is measured. The relationship between binding and ligand concentration is then...
Open the catalog to page 6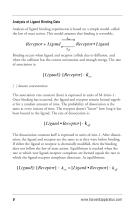
Analysis of Ligand Binding Data Analysis of ligand binding experiments is based on a simple model, called the law of mass action. This model assumes that binding is reversible. Receptor + Ligand Receptor • Ligand Binding occurs when ligand and receptor collide due to diffusion, and when the collision has the correct orientation and enough energy. The rate [ ] denotes concentration The association rate constant (kon) is expressed in units of M-lmin-1 . Once binding has occurred, the ligand and receptor remain bound togeth- er for a random amount of time. The probability of dissociation is the...
Open the catalog to page 7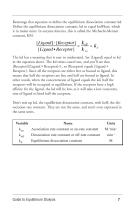
Rearrange that equation to define the equilibrium dissociation constant kd. Define the equilibrium dissociation constant, kd to equal koff/kon, which is in molar units. In enzyme kinetics, this is called the Michaelis-Menten [Ligand] • [Receptor] koff The kd has a meaning that is easy to understand. Set [Ligand] equal to kd in the equation above. The kd terms cancel out, and you'll see that [Receptor]/[Ligand • Receptor] = l, so [Receptor] equals [Ligand • Receptor]. Since all the receptors are either free or bound to ligand, this means that half the receptors are free and half are bound to ligand....
Open the catalog to page 8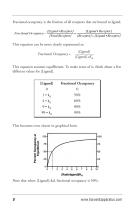
Fractional occupancy is the fraction of all receptors that are bound to ligand. [Ligand • Receptor] [Ligand • Receptor] [Total Receptor] [Receptor] + [Ligand • Receptor] This equation can be more clearly represented as: This equation assumes equilibrium. To make sense of it, think about a few different values for [Ligand]. Fractional Occupancy This becomes even clearer in graphical form. [Radiol igand]/Kd Note that when [Ligand] =kd, fractional occupancy is 50%.
Open the catalog to page 9
Although termed a “law”, the law of mass action is simply a model that can be used to explain some experimental data. Because it is so simple, the model is not useful in all situations. The model assumes: – – – – All receptors are equally accessible to ligands. Receptors are either free or bound to ligand. It doesn’t allow for more than one affinity state, or states of partial binding. Binding does not alter the ligand or receptor. Binding is reversible. Despite its simplicity, the law of mass action has proven to be very useful in describing many aspects of receptor pharmacology and physiology....
Open the catalog to page 10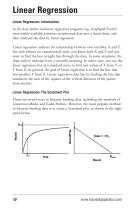
Linear Regression Linear Regression: Introduction In the days before nonlinear regression programs (eg. Graphpad Prism®) were widely available,scientists transformed data into a linear form, and then analyzed the data by linear regression. Linear regression analyzes the relationship between two variables, X and Y. For each subject (or experimental unit), you know both X and Y and you want to find the best straight line through the data. In some situations, the slope and/or intercept have a scientific meaning. In other cases, you use the linear regression line as a standard curve to find new values...
Open the catalog to page 11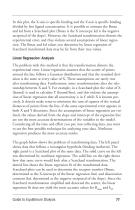
In this plot, the X-axis is specific binding and the Y-axis is specific binding divided by free ligand concentration. It is possible to estimate the Bmax and kd from a Scatchard plot (Bmax is the X intercept; kd is the negative reciprocal of the slope). However, the Scatchard transformation distorts the experimental error, and thus violates several assumptions of linear regression. The Bmax and kd values you determine by linear regression of Scatchard transformed data may be far from their true values. Linear Regression: Analysis The problem with this method is that the transformation distorts...
Open the catalog to page 12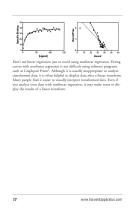
[Ligand] Bound Don't use linear regression just to avoid using nonlinear regression. Fitting curves with nonlinear regression is not difficult using software programs such as Graphpad Prism®. Although it is usually inappropriate to analyze transformed data, it is often helpful to display data after a linear transform. Many people find it easier to visually interpret transformed data. Even if you analyze your data with nonlinear regression, it may make sense to dis- play the results of a linear transform.
Open the catalog to page 13All Harvard Bioscience, Inc. catalogs and technical brochures
 Biowave 3 & Biowave 3+
2 Pages
 Scie-Plas Product Catalogue
132 Pages
 CMA Microdialysis Catalog
56 Pages
 EZ READ 400 ELISA
3 Pages


- Automation software solution
- Analysis software solution
- Liquids analyzer
- Rack system
- Automatic analyser
- Windows software
- Control software
- Solids analyser
- Measurement software
- Laboratory analyzer
- Development software
- Spectrophotometer
- Analyzer for the food industry
- Data acquisition software
- Visible spectrophotometer
- UV spectrophotometer
- Hydrometer
- Modular rack system
- USB spectrophotometer
- Laboratory software